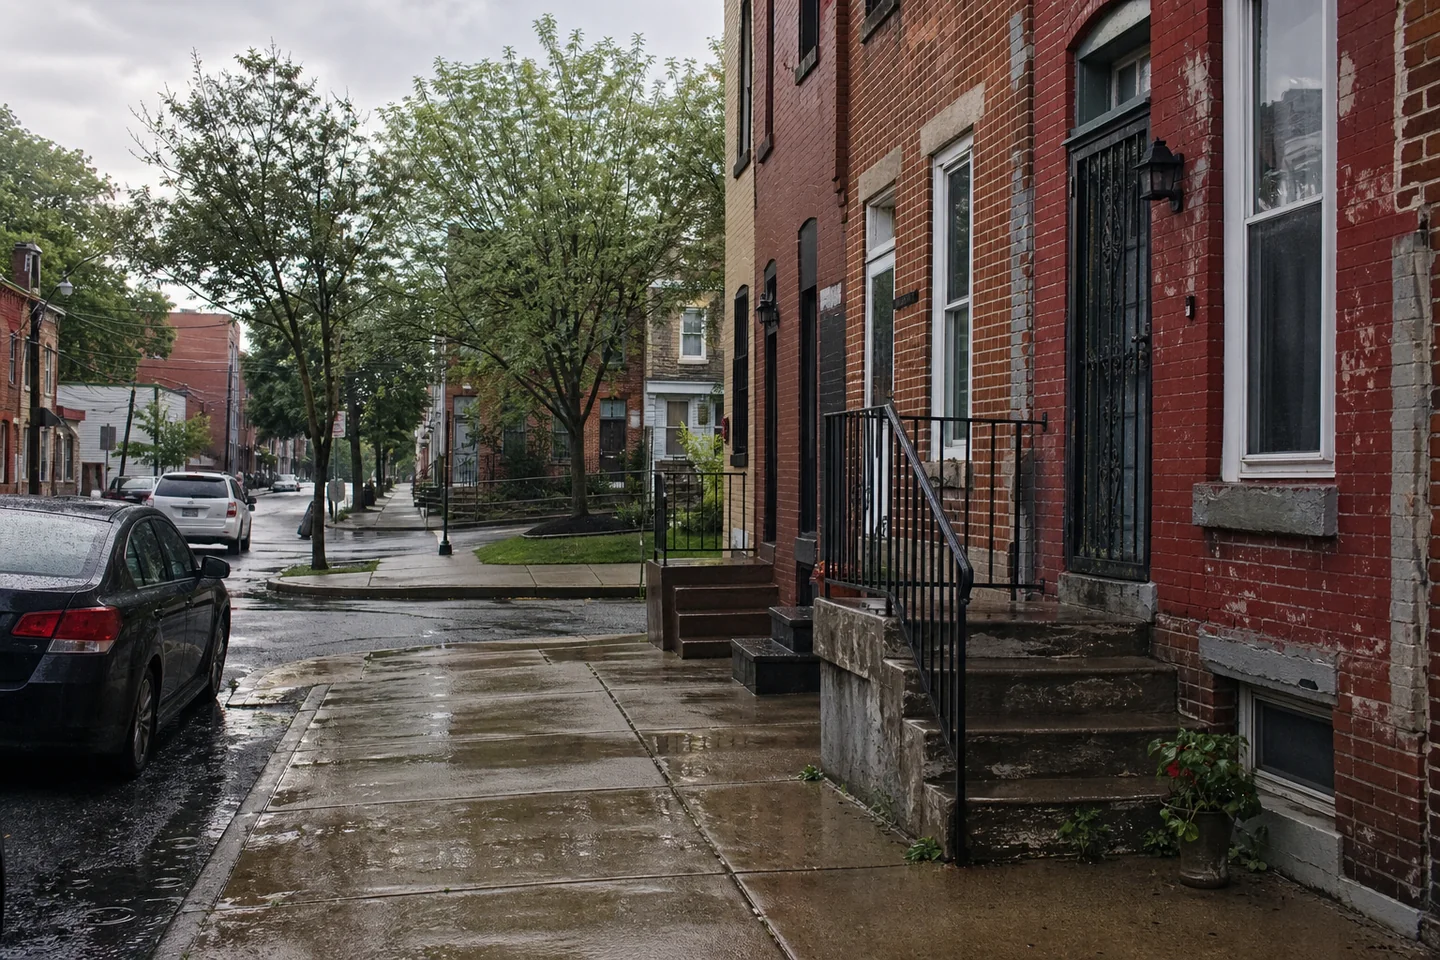
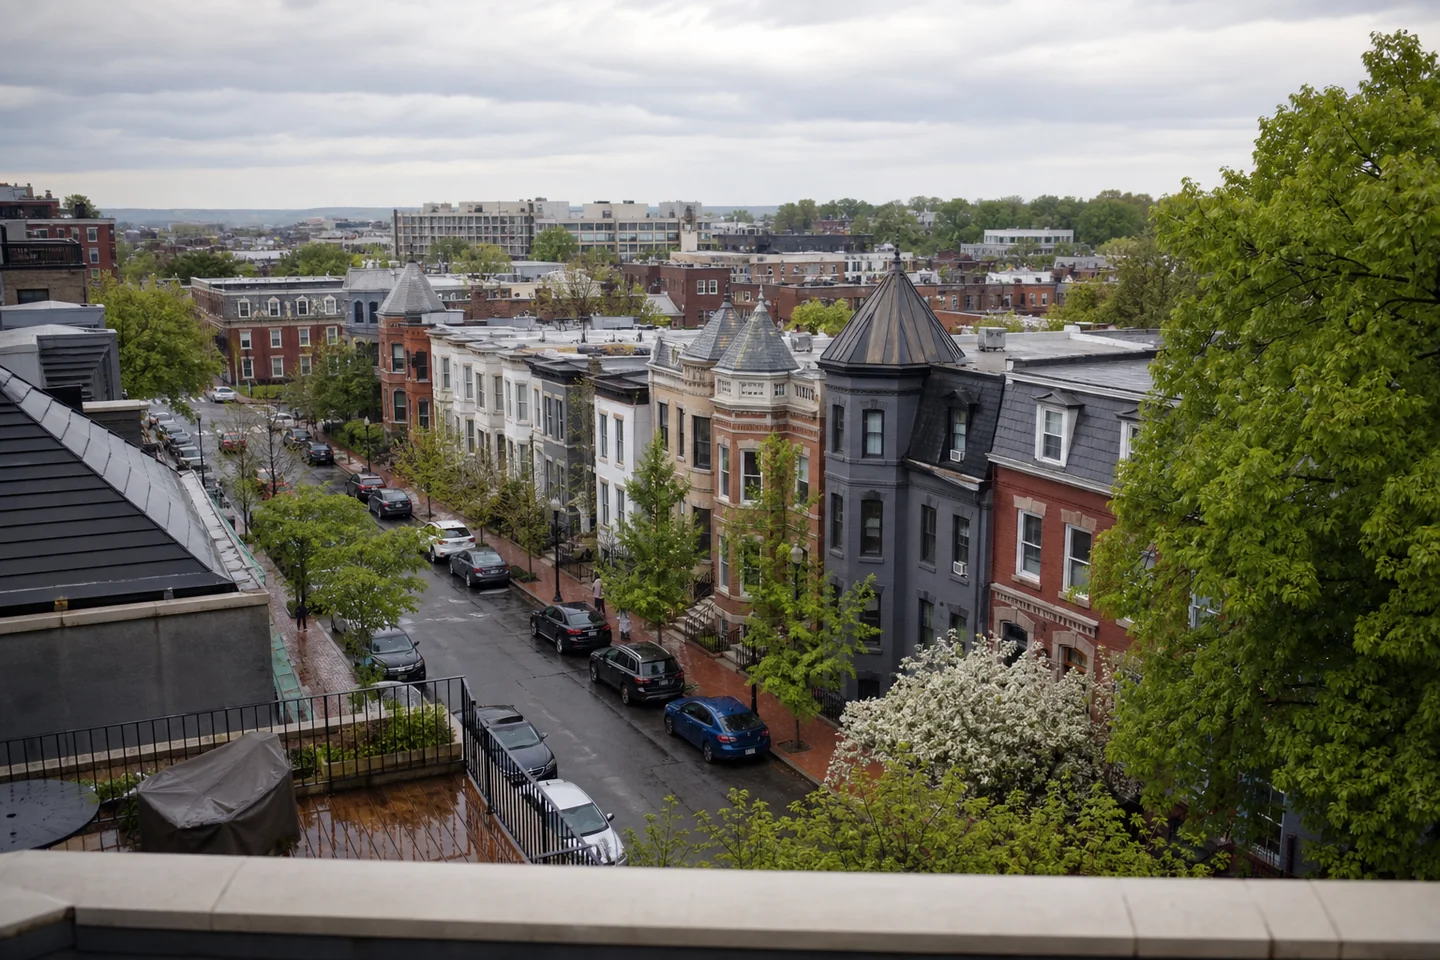
Baltimore, MD merits property-level underwriting first for cash-flow and entry-affordability strategies. Its Zillow value index is $192,669 versus $579,159 in Washington, DC, while gross yield is 11.20% versus 5.25%. Baltimore’s price-to-income measure is also lower, at 3.10 versus 5.27. That combination offers a substantially lower acquisition hurdle and more gross income relative to indexed value, but it is not a net-return forecast.
Washington better fits renter-pressure and local-demand objectives. Renters represent 58.49% of Washington households versus 52.49% in Baltimore, and vacancy is lower at 10.12% versus 13.34%. Population change between overlapping ACS vintages was -1.64% in Washington and -5.88% in Baltimore. Yet affordability pressure points the other way: Baltimore’s rent-burden rate is 53.68%, compared with 46.60% in Washington, signaling constrained tenant budgets rather than automatically stronger rent-growth capacity.
Housing-stock fit depends on the intended asset. Baltimore is 65.13% single-family and has a 1947 median year built, favoring house-oriented sourcing but requiring close inspection of systems and capital needs. Washington is 42.03% large multifamily, making it more aligned with apartment underwriting, while its 1958 median year built still warrants physical diligence. Next, compare neighborhood-level asking rents, occupancy, taxes, insurance, licensing, deferred maintenance and renovation scope for actual candidates before advancing either city.