Compare city evidence without borrowing metro averages.
RentMarker publishes only deliberate city pairs with complete direct Zillow and Census records, reviewed city briefs and multiple material differences. Missing evidence remains n/a.
One decision, two different boundaries.
Metro and city pages may share familiar place names, but they answer different questions and never share figures across boundaries.
Open the pairs that differ on the question you care about.
Showing 98 curated pairs across all decision lenses.
Showing 72 curated pairs with a material entry price difference.
Showing 69 curated pairs with a material buyer affordability difference.
Showing 69 curated pairs with a material gross yield difference.
Showing 83 curated pairs with a material renter pressure difference.
Showing 92 curated pairs with a material housing stock difference.
Showing 87 curated pairs with a material local demand difference.
Keep state policy constant, then inspect the city trade-off.
These pairs share a state but differ materially on entry price, rent economics, renter pressure, housing form or local demand.
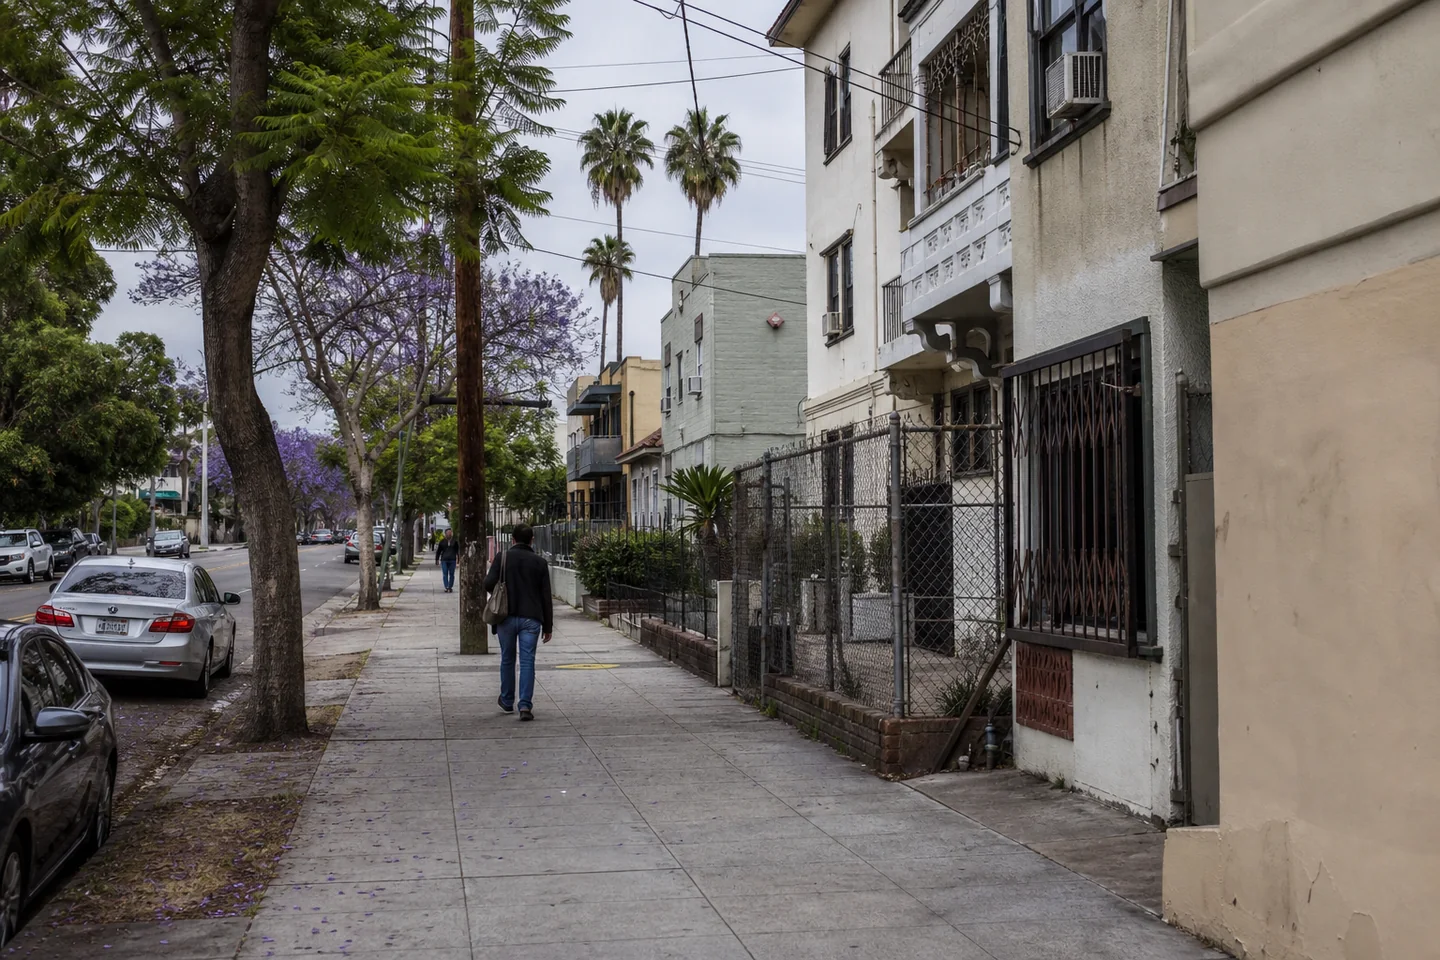
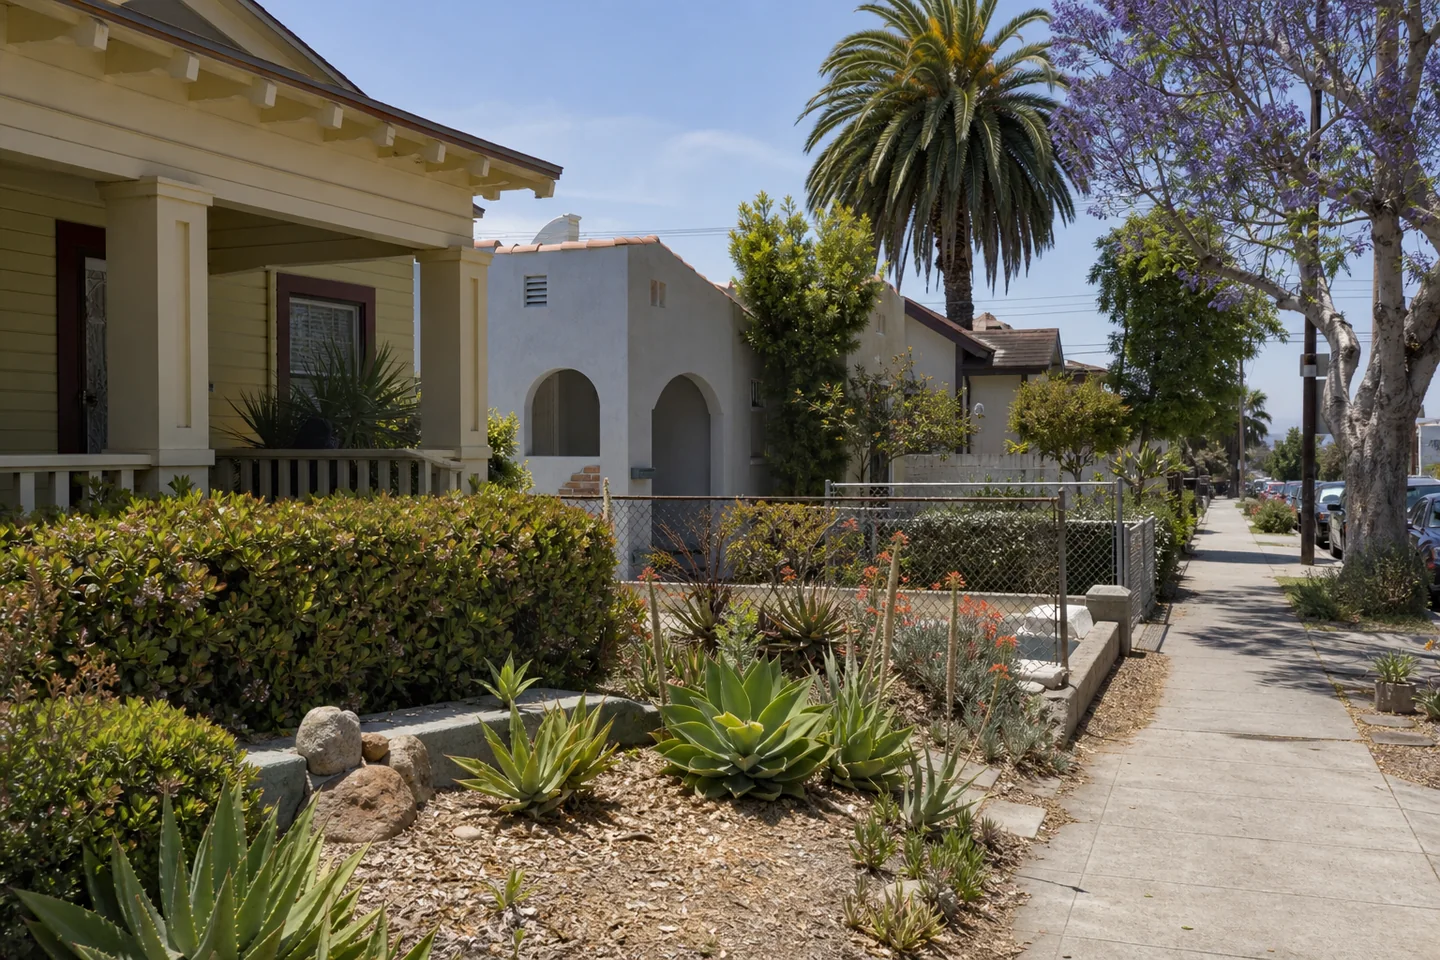
Southern California alternatives whose affordability, renter pressure, housing form and recent city demand evidence lead to different property checks.
- Los Angeles
- $949k · 3.5% yield
- San Diego
- $1002k · 3.6% yield

California gateway cities with material differences across entry cost, affordability, renter pressure, housing stock and local demand risk.
- Los Angeles
- $949k · 3.5% yield
- San Francisco
- $1396k · 3.8% yield
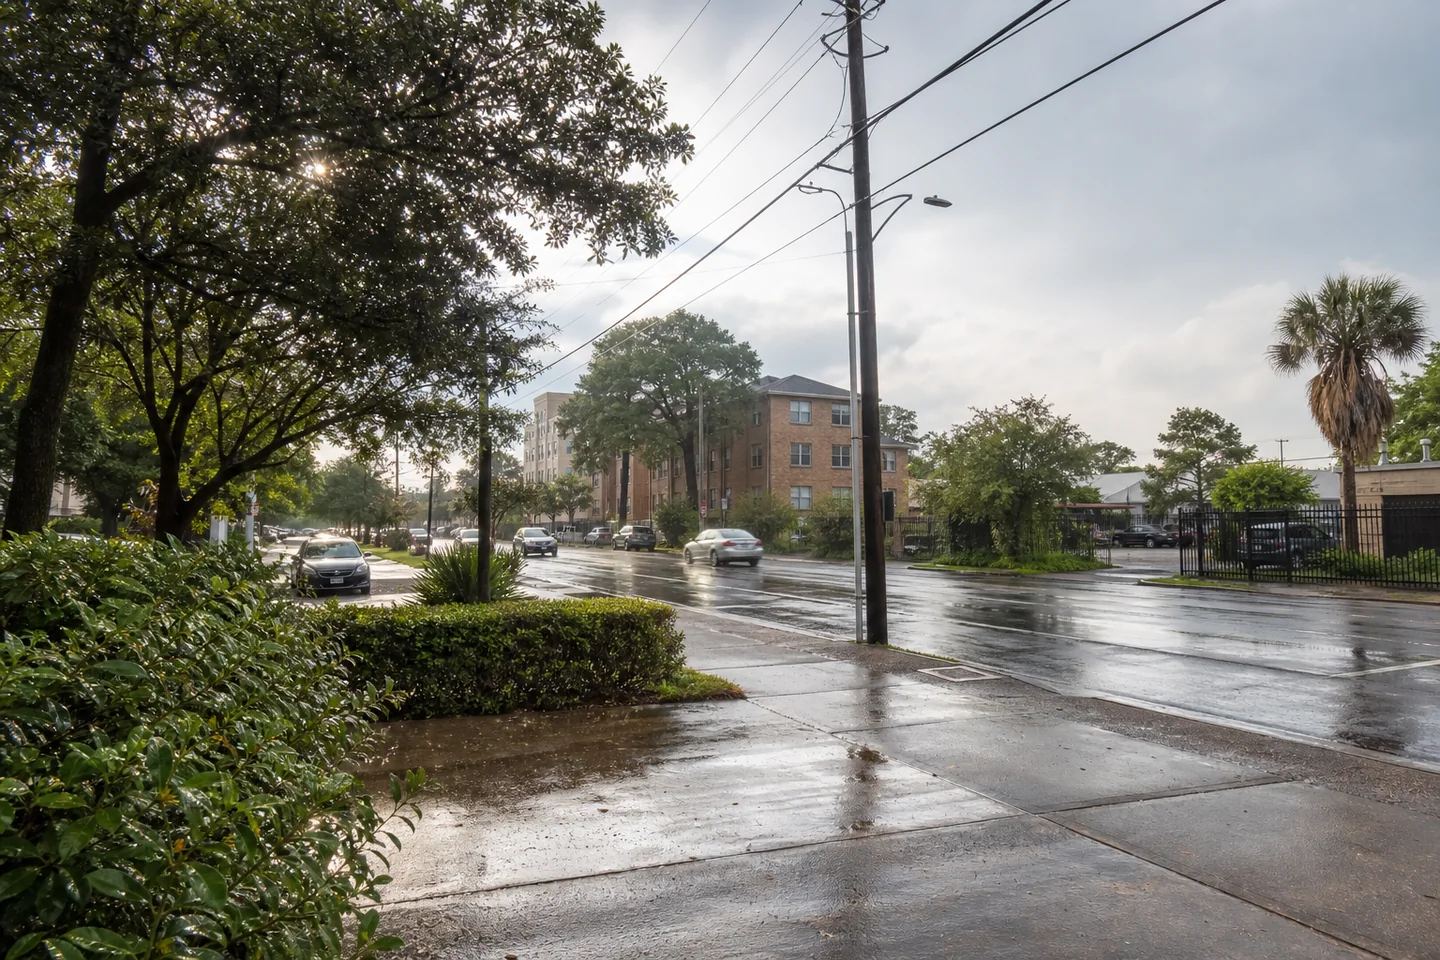
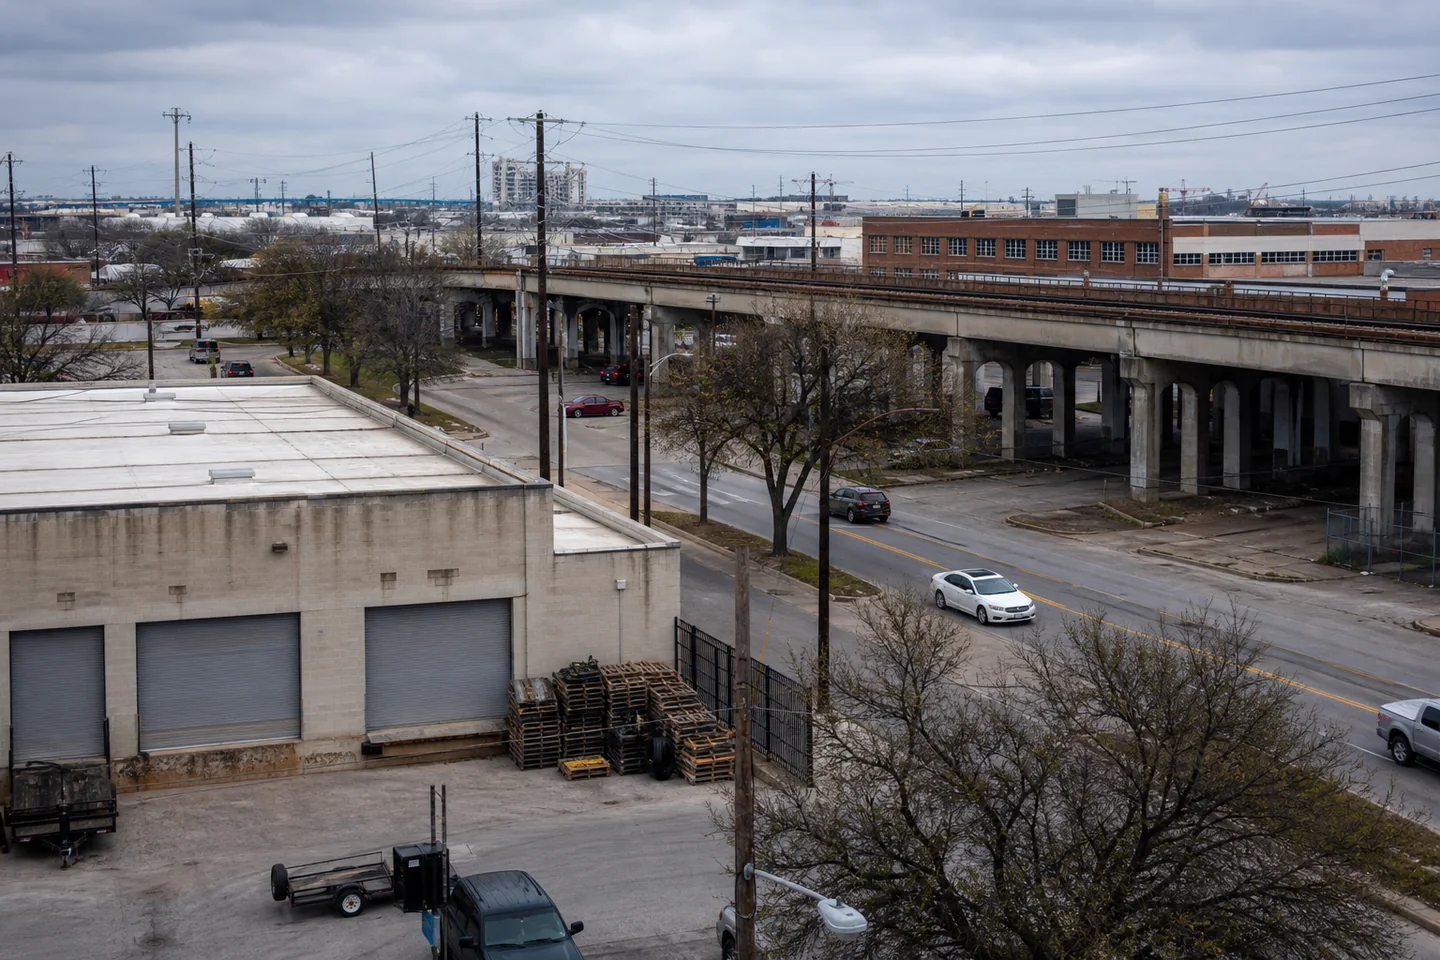
Large Texas cities whose gross yield, entry price and local demand-risk evidence produce distinct property-level priorities.
- Houston
- $265k · 7.1% yield
- Dallas
- $311k · 6.2% yield

Texas population centers whose renter pressure, housing stock and recent local demand evidence point to different leasing checks.
- Houston
- $265k · 7.1% yield
- San Antonio
- $251k · 6.6% yield
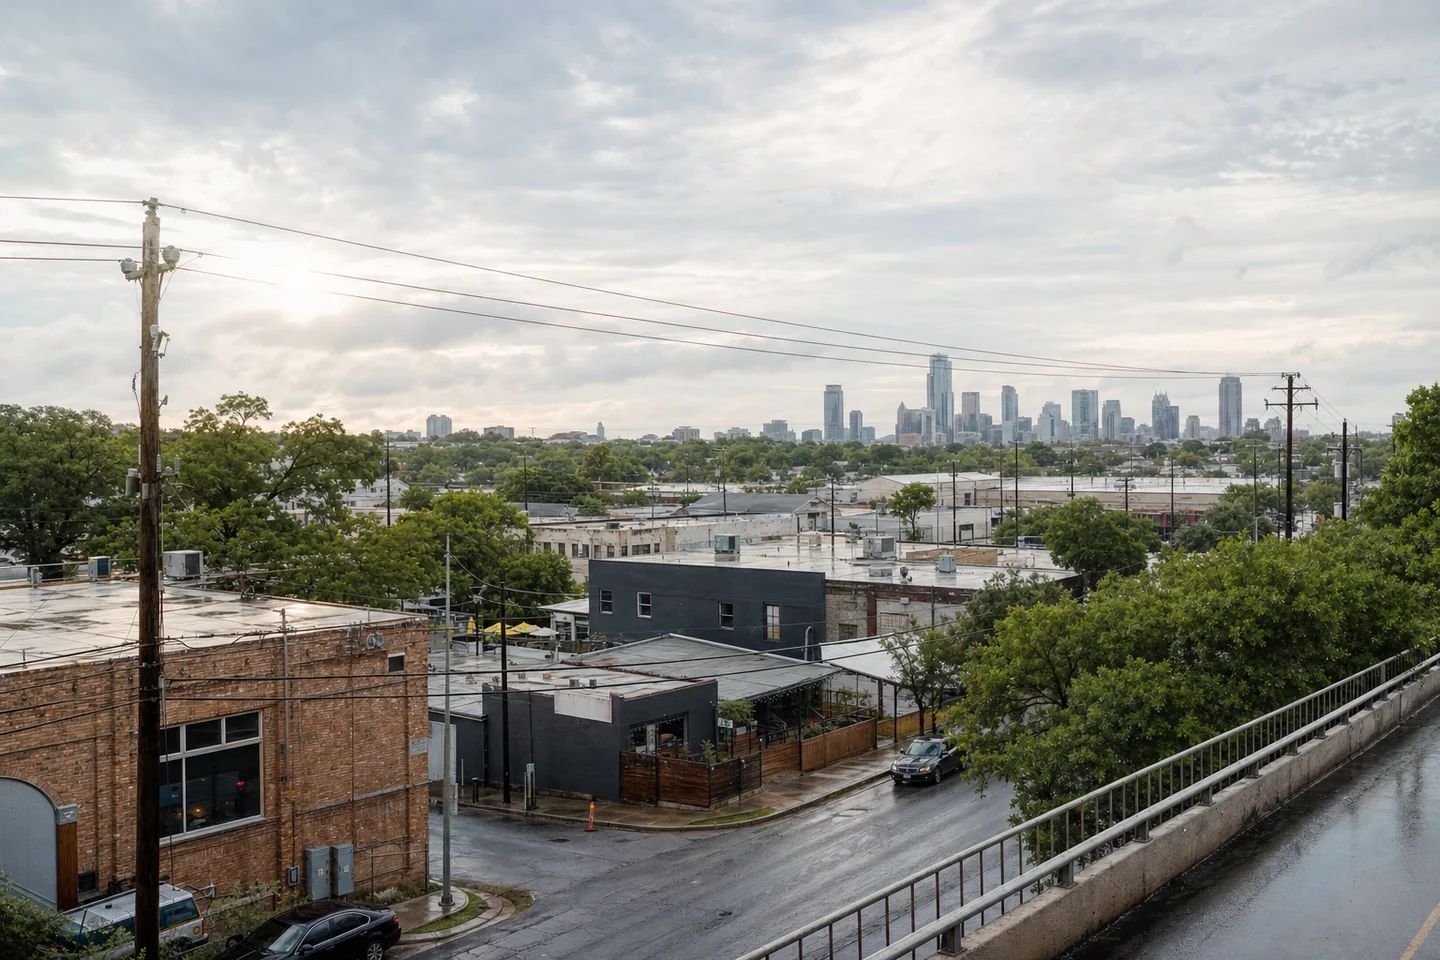
Central Texas alternatives with material differences across every city comparison lens, from acquisition economics to housing form and demand risk.
- Austin
- $508k · 3.8% yield
- San Antonio
- $251k · 6.6% yield

Lower-cost Texas alternatives with different gross-yield, renter-pressure, housing-form and city-demand profiles.
- El Paso
- $238k · 7.7% yield
- San Antonio
- $251k · 6.6% yield

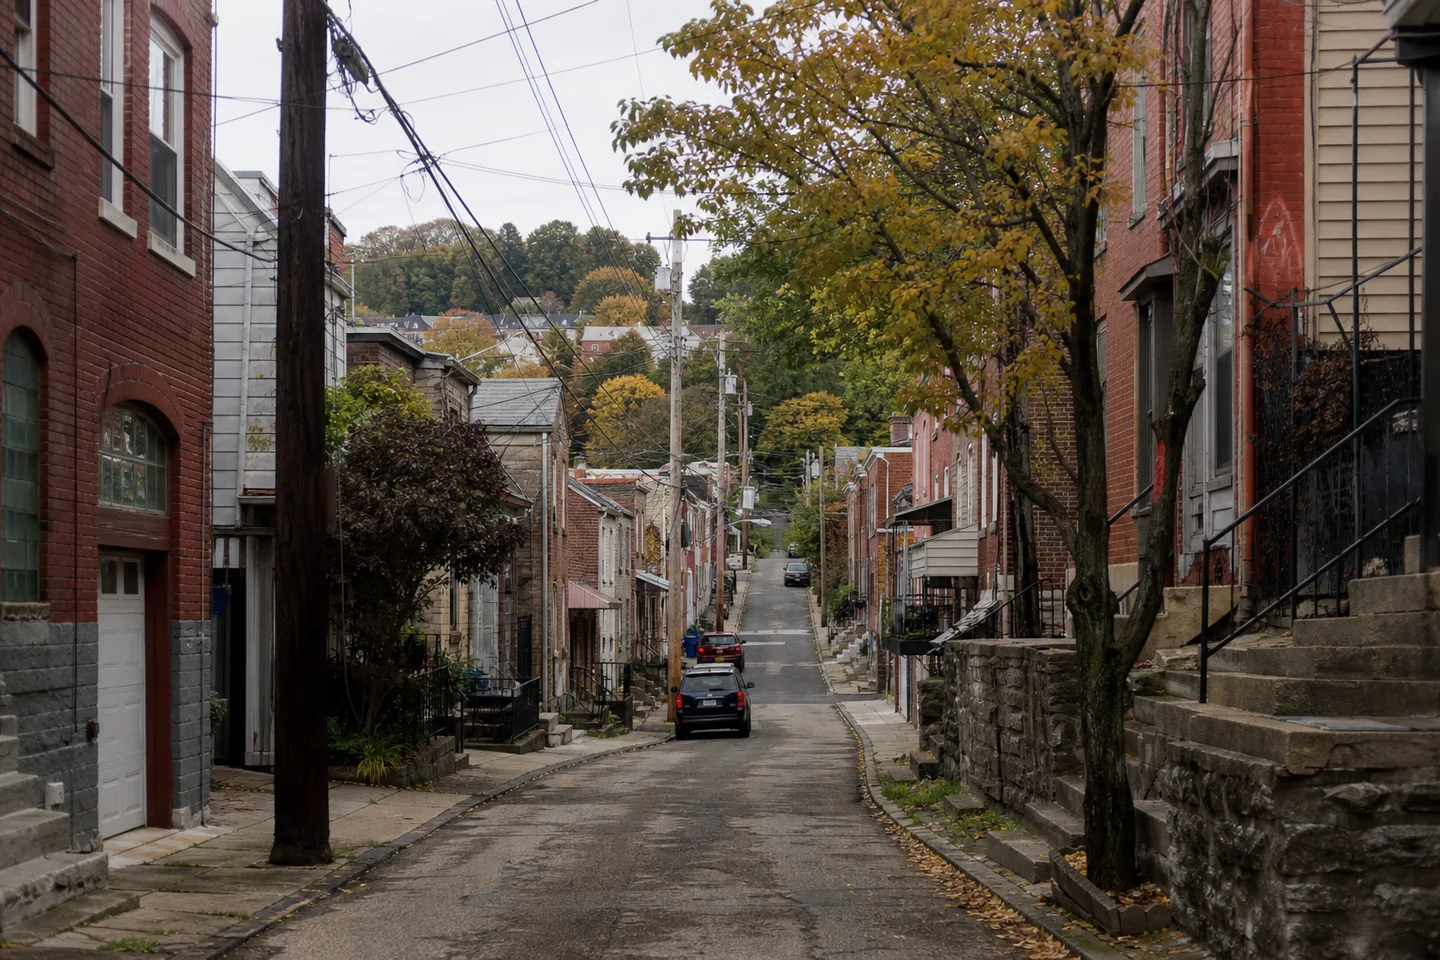
Pennsylvania's largest city alternatives with materially different gross-yield, renter-pressure, housing-stock and recent demand evidence.
- Philadelphia
- $237k · 9.2% yield
- Pittsburgh
- $246k · 7.8% yield
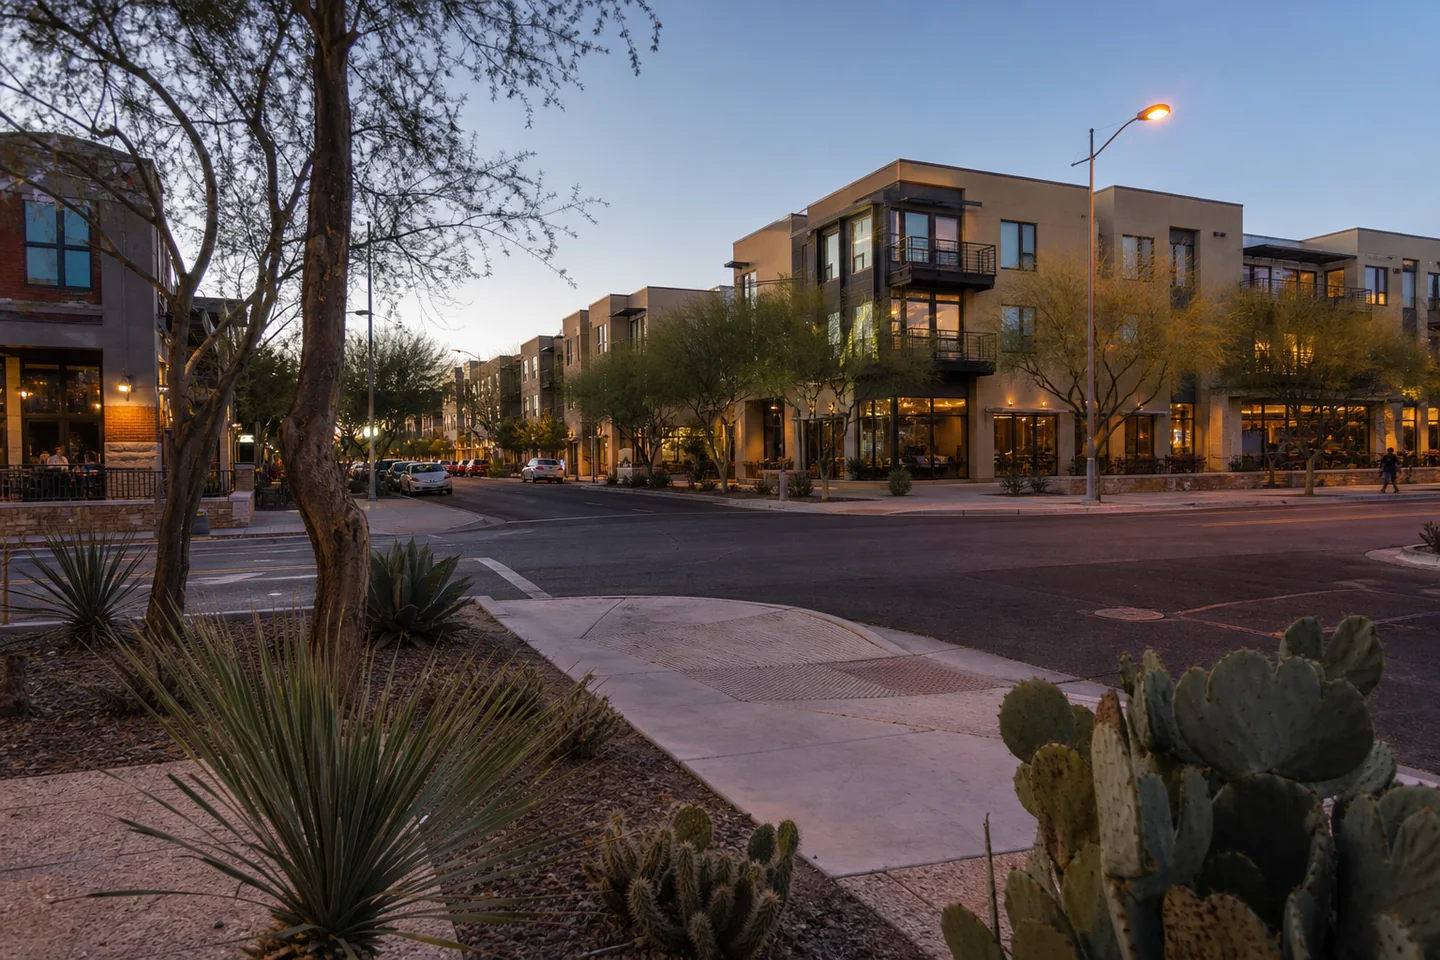

Neighboring Arizona cities with sharply different gross yield, acquisition cost, affordability, housing form and city demand risk.
- Phoenix
- $410k · 4.6% yield
- Scottsdale
- $858k · 3.0% yield
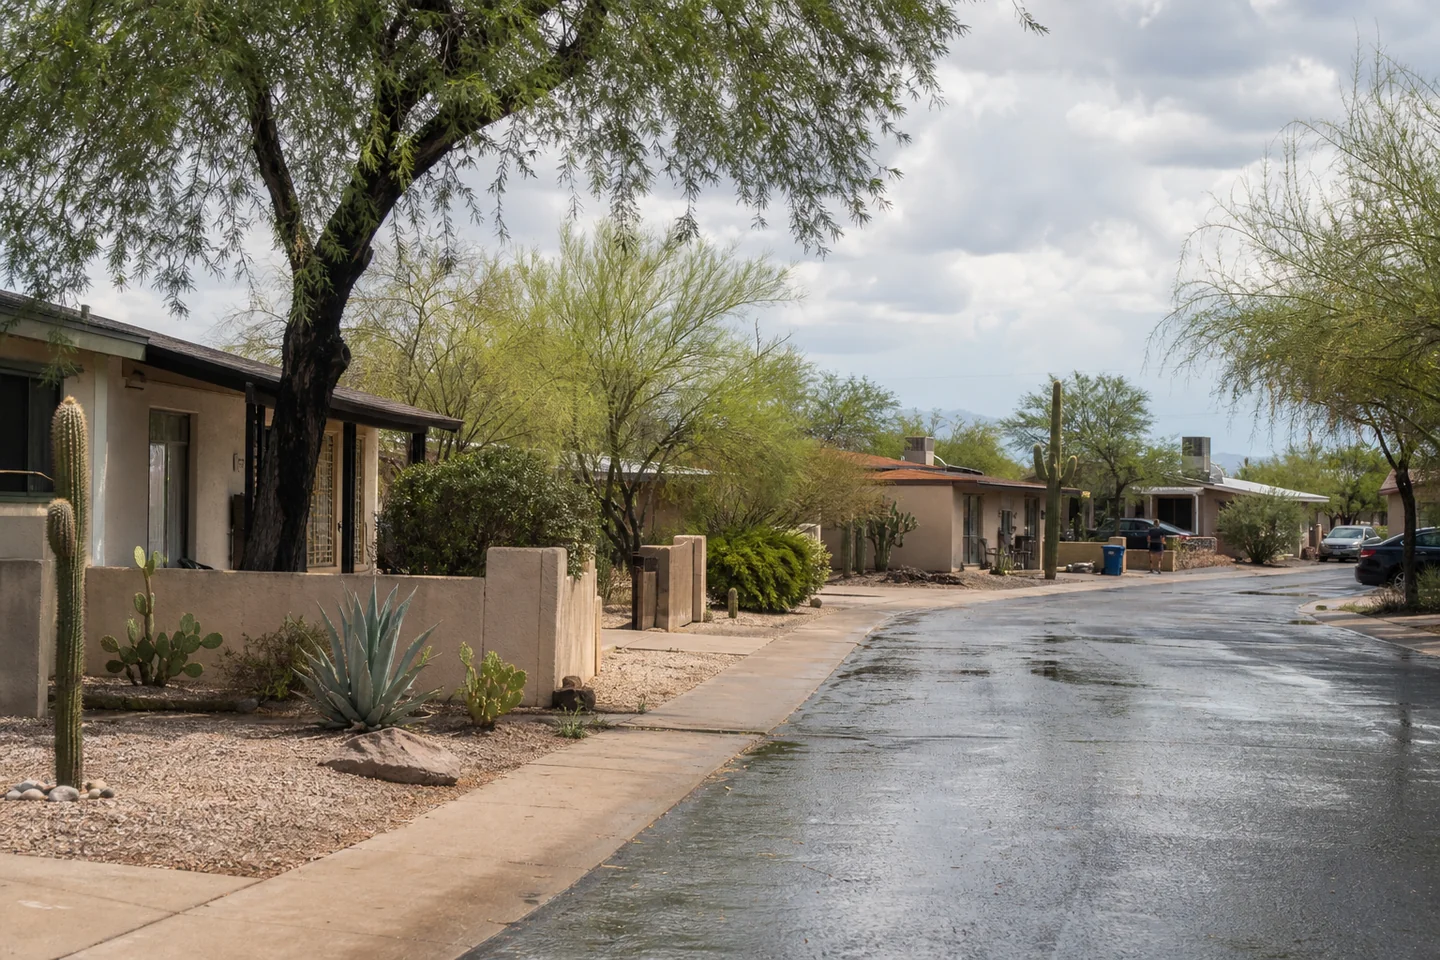
Arizona's largest city alternatives with material differences in entry price, renter pressure and recent local demand evidence.
- Phoenix
- $410k · 4.6% yield
- Tucson
- $326k · 5.3% yield

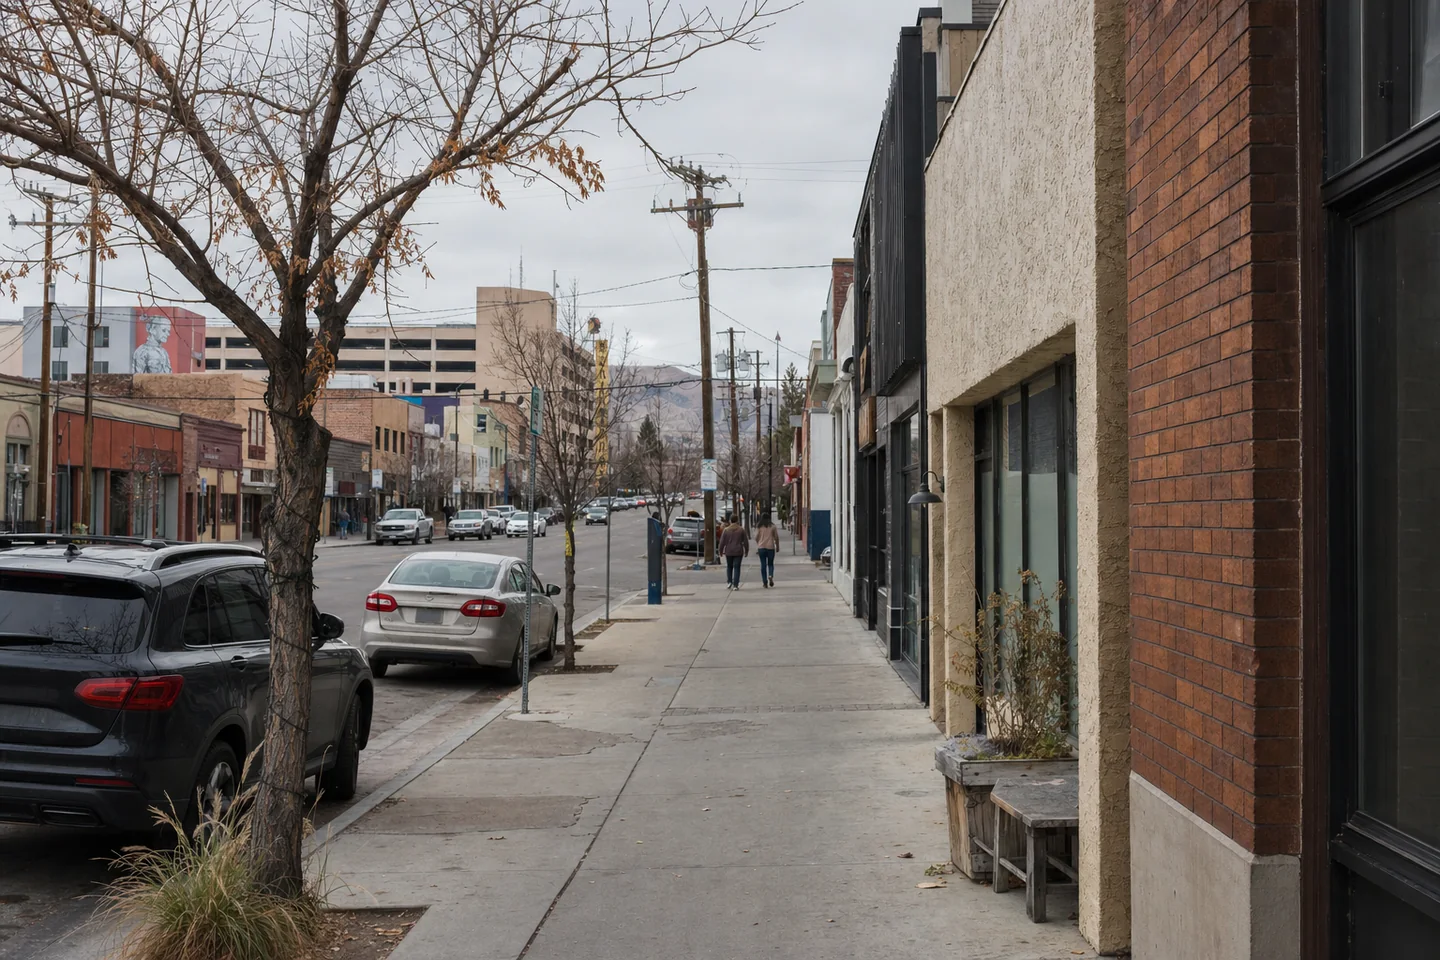
Nevada's principal city alternatives with material differences across all six selection signals and distinct property-level follow-up needs.
- Las Vegas
- $426k · 4.9% yield
- Reno
- $577k · 4.0% yield
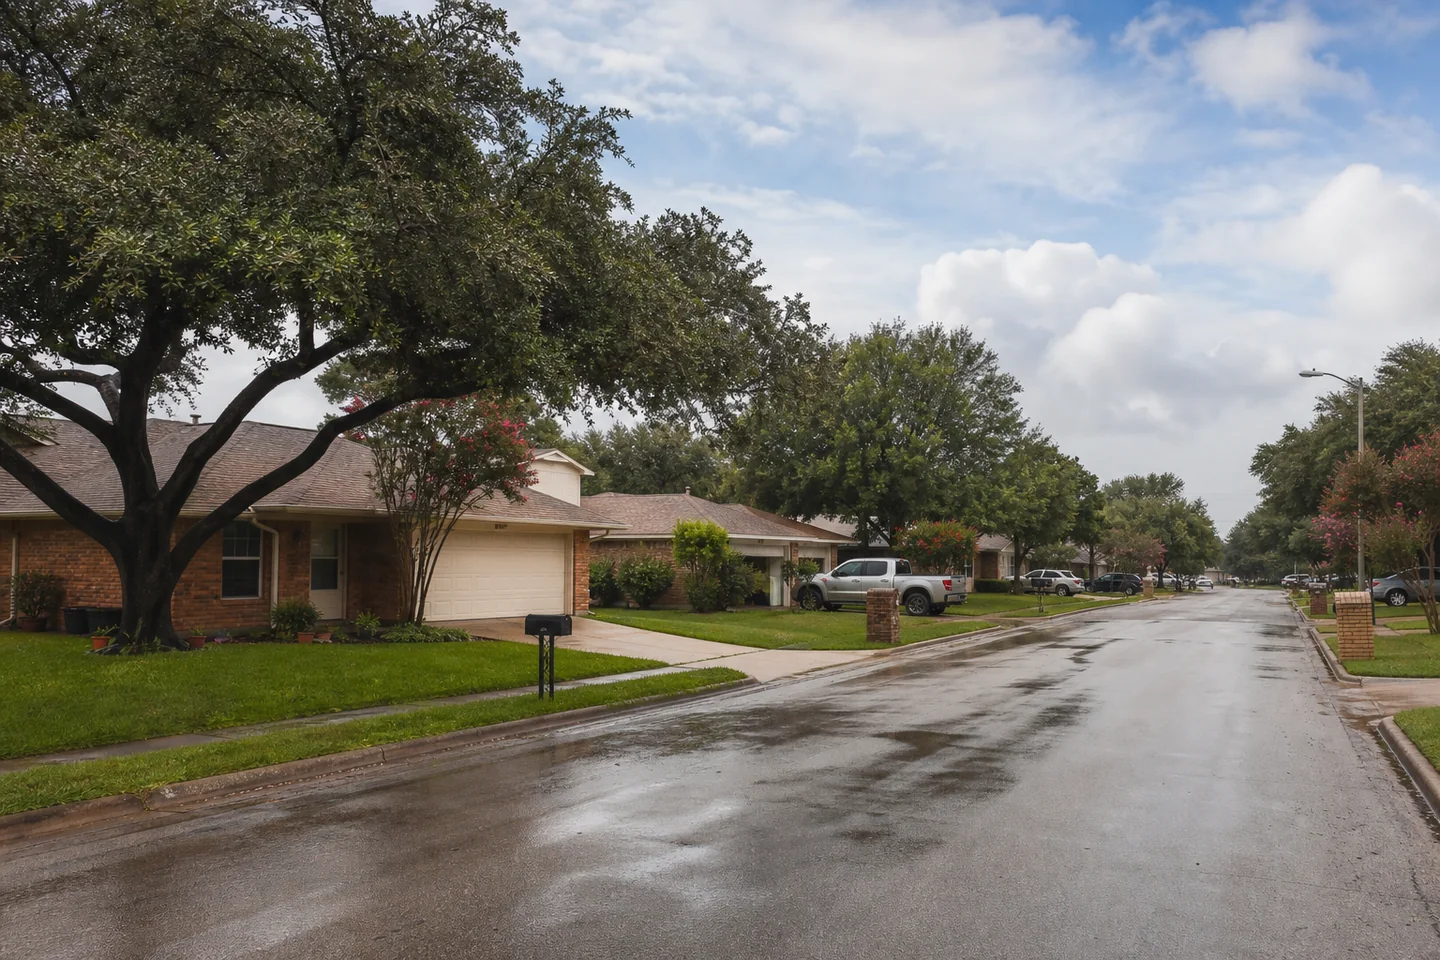
Cities within the same regional economy whose direct renter-pressure, housing-stock and local-demand records should not be replaced by one metro average.
- Dallas
- $311k · 6.2% yield
- Arlington
- $314k · 5.9% yield
Two major Texas cities with materially different entry cost, gross yield, affordability, renter pressure, housing stock and recent population evidence.
- Dallas
- $311k · 6.2% yield
- Austin
- $508k · 3.8% yield
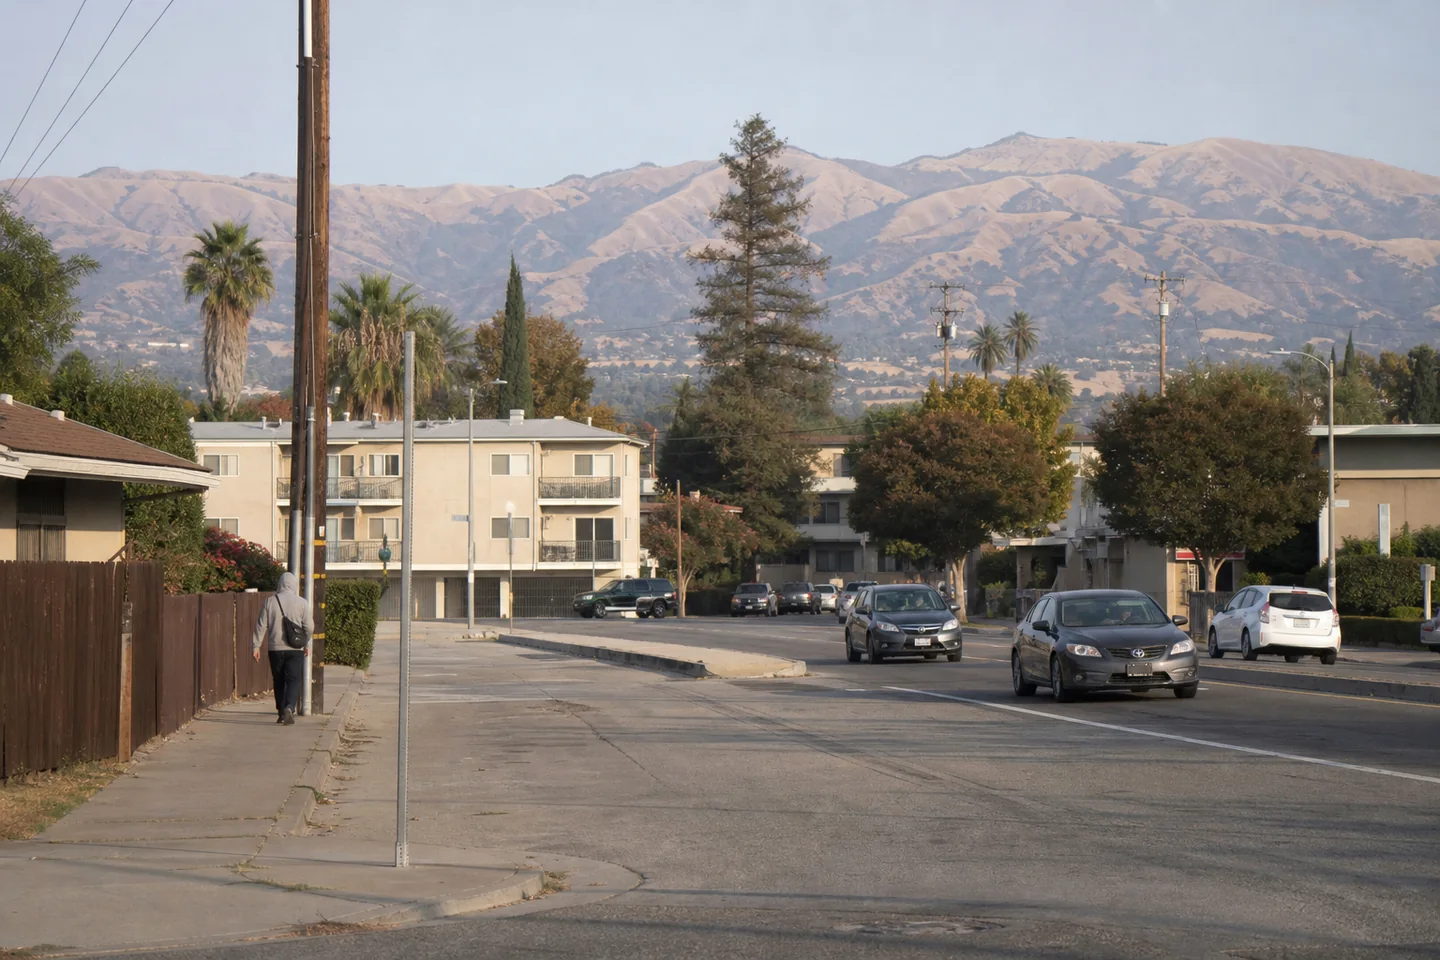
Bay Area city choices with different gross-yield, renter-pressure and housing-form evidence despite sharing a wider regional economy.
- San Francisco
- $1396k · 3.8% yield
- San Jose
- $1414k · 3.0% yield
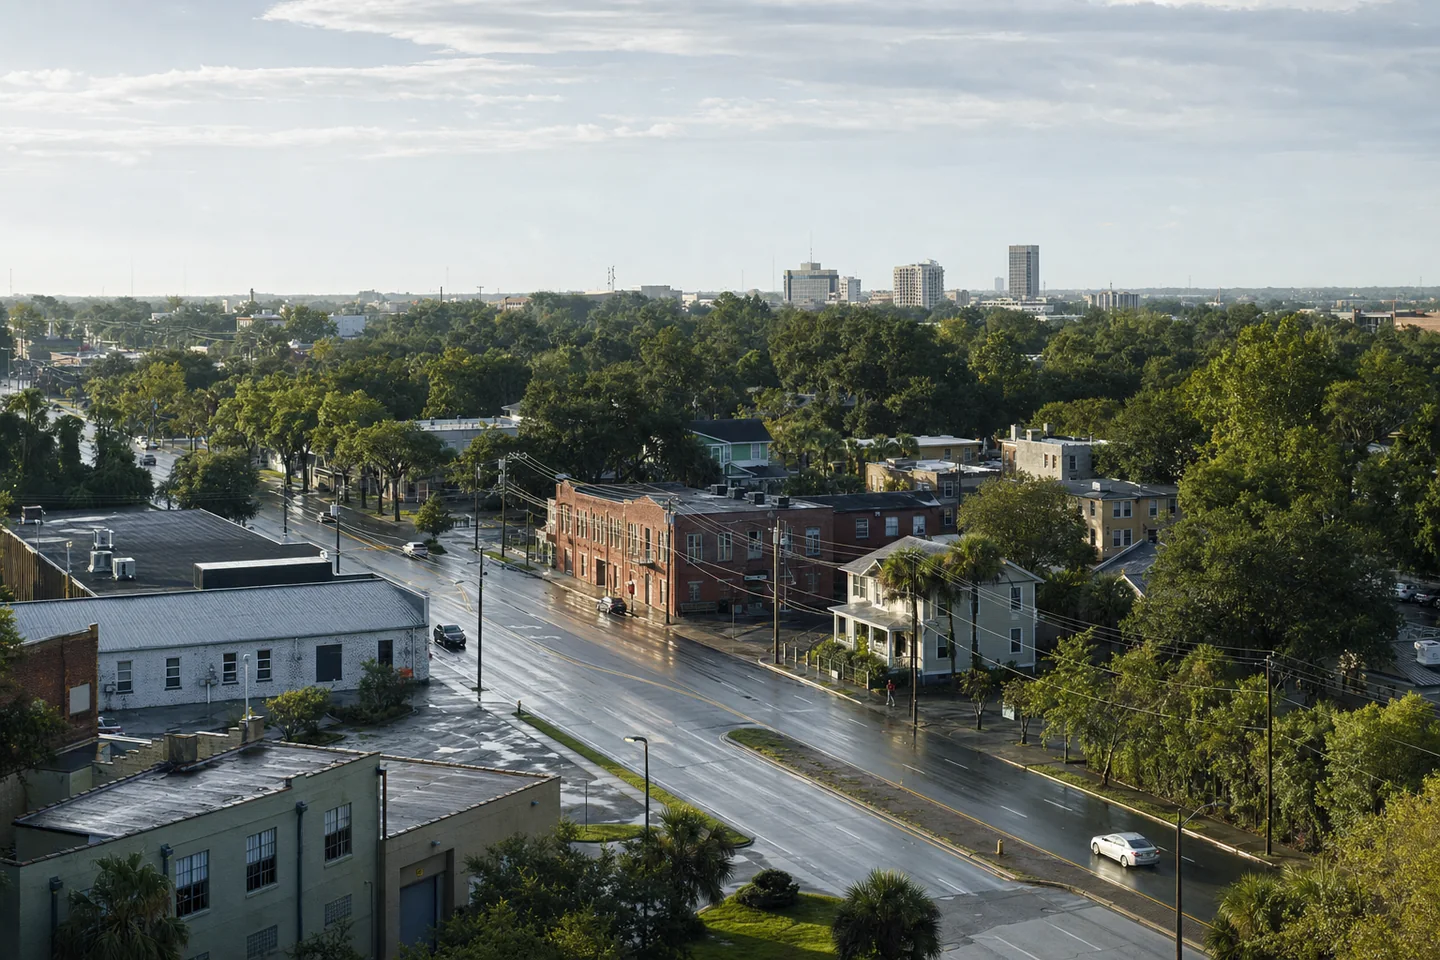
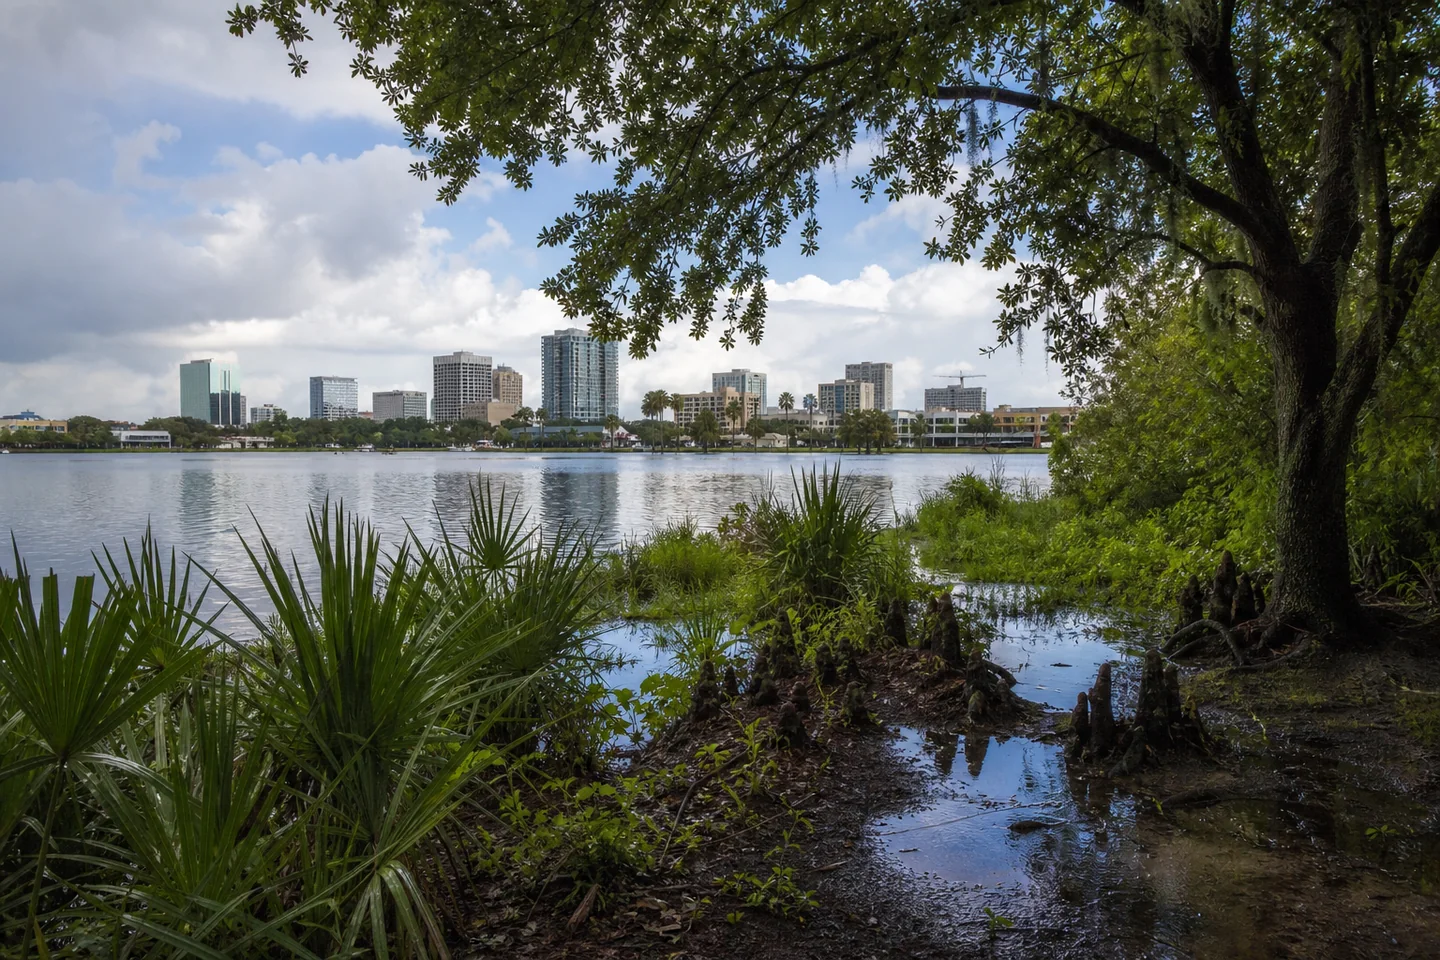
Florida alternatives whose entry cost, affordability, renter pressure, housing stock and recent demand evidence create different underwriting constraints.
- Jacksonville
- $288k · 6.7% yield
- Orlando
- $375k · 6.1% yield
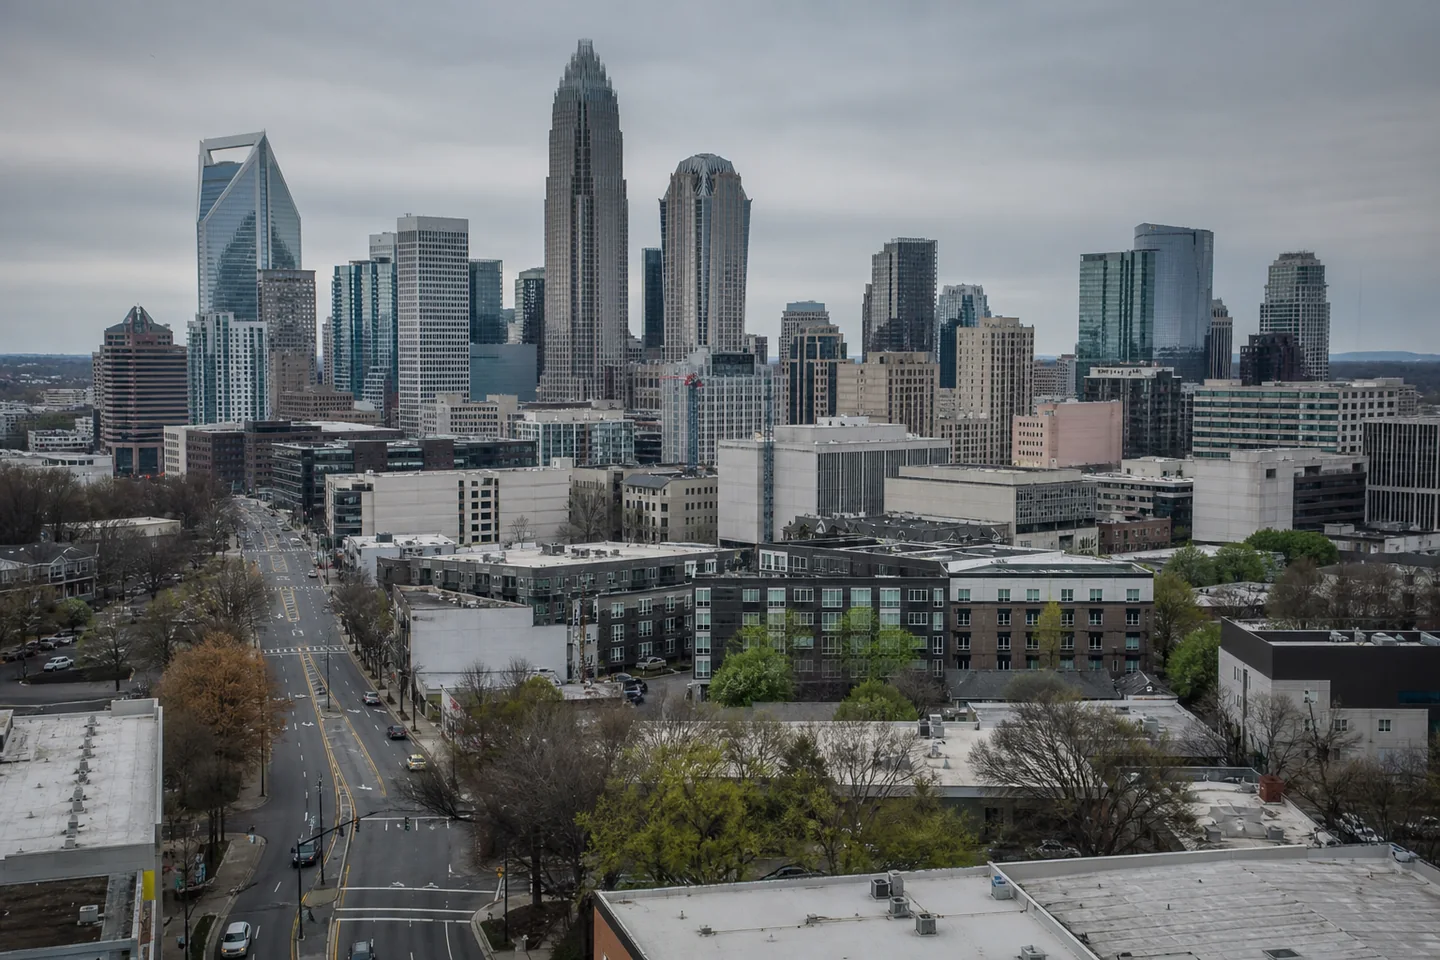
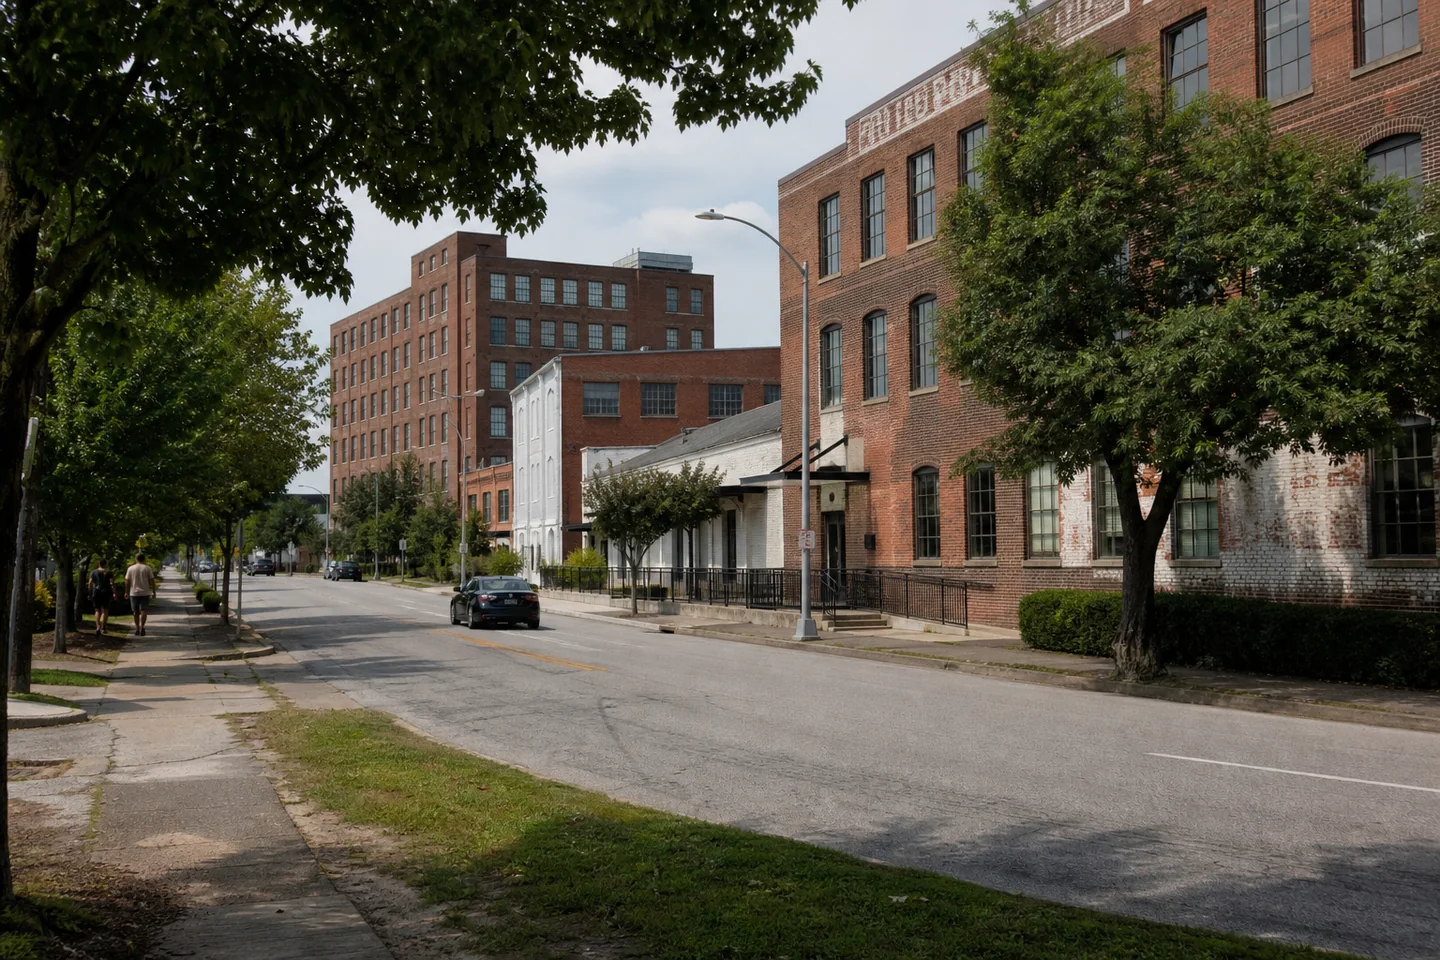
North Carolina cities whose gross-yield, entry-price and recent demand evidence separate a larger growth hub from a lower-cost alternative.
- Charlotte
- $399k · 5.2% yield
- Greensboro
- $266k · 6.4% yield

Florida city alternatives whose price, affordability, renter pressure, housing form and local demand evidence create different underwriting constraints.
- Miami
- $583k · 6.2% yield
- Orlando
- $375k · 6.1% yield
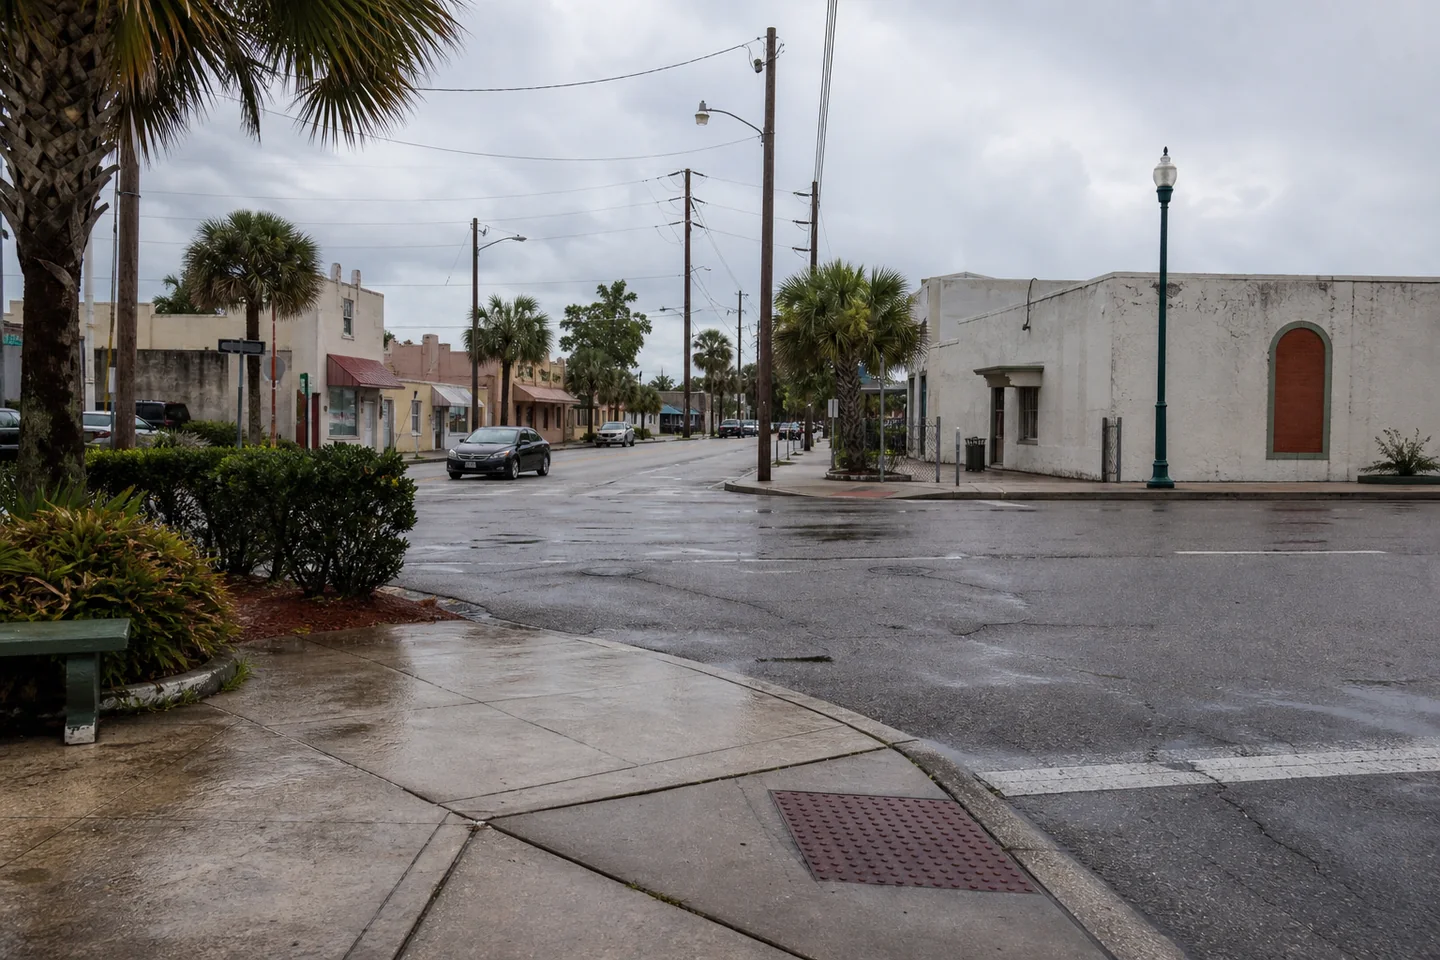
Closely linked Central Florida cities whose direct affordability, renter-pressure, housing-stock and demand records require separate property screens.
- Orlando
- $375k · 6.1% yield
- Kissimmee
- $359k · 6.8% yield
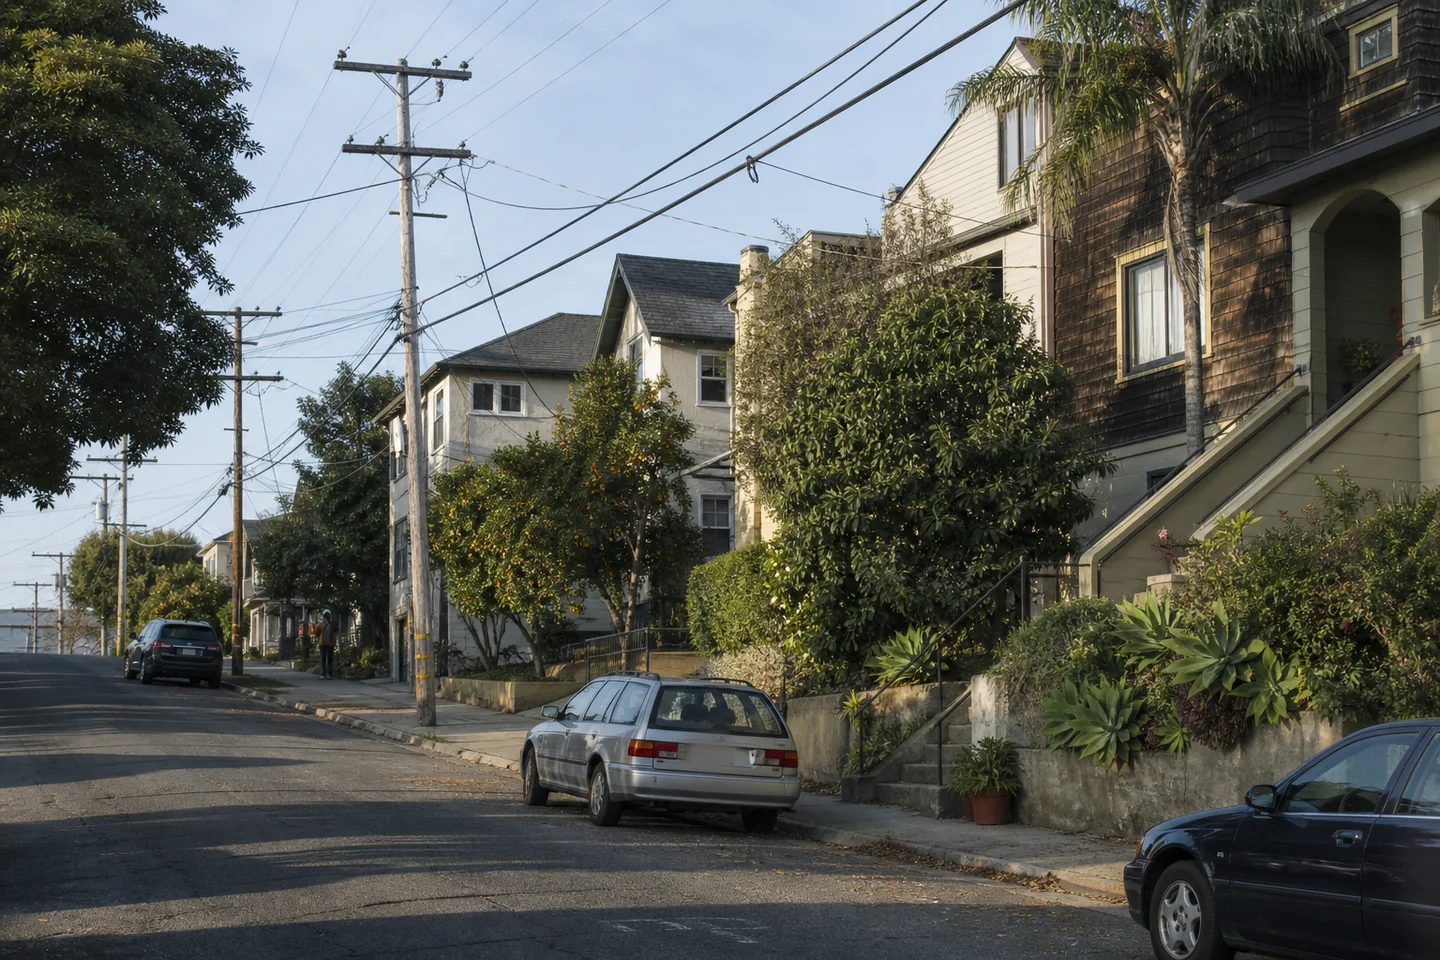
Neighboring Bay cities whose direct records separate entry price, affordability, renter pressure, housing stock and local demand risk.
- Oakland
- $722k · 4.3% yield
- San Francisco
- $1396k · 3.8% yield


Large Ohio cities with different affordability, renter pressure, housing form and local demand-risk profiles despite similar current gross yields.
- Columbus
- $251k · 7.0% yield
- Cincinnati
- $255k · 6.9% yield
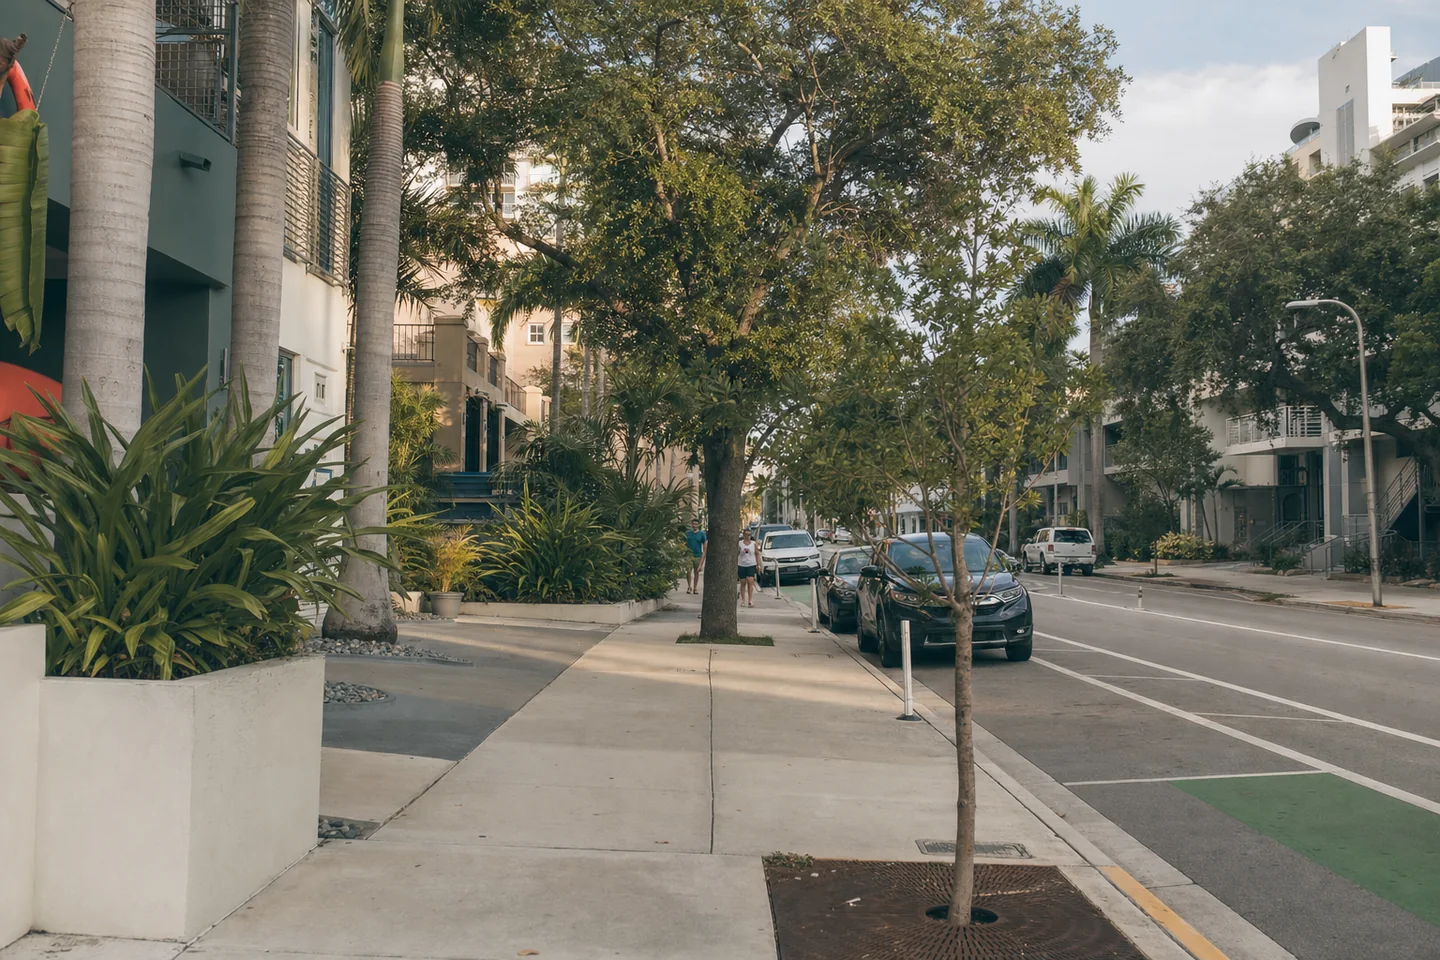
Neighboring South Florida cities whose direct affordability, renter-pressure and housing-stock measures expose meaningful boundary-level differences.
- Miami
- $583k · 6.2% yield
- Fort Lauderdale
- $512k · 6.6% yield
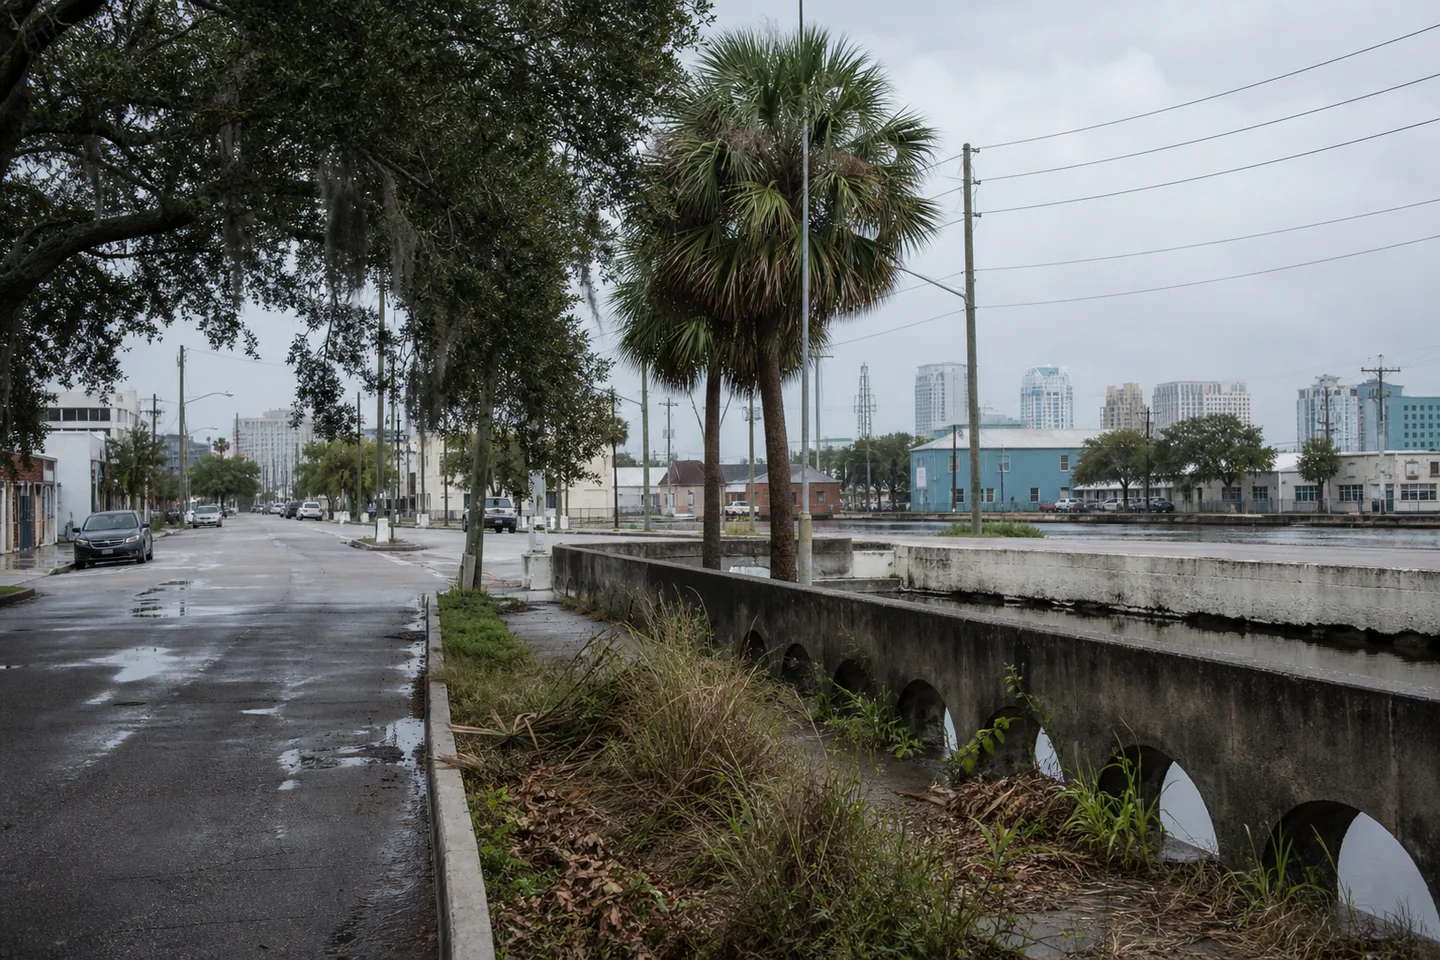
Major Florida cities with material differences in acquisition cost, buyer affordability, renter pressure and housing form.
- Miami
- $583k · 6.2% yield
- Tampa
- $380k · 6.3% yield


Front Range alternatives with material differences in entry price, renter pressure and housing form that require separate city-level underwriting.
- Denver
- $539k · 4.2% yield
- Colorado Springs
- $450k · 4.6% yield

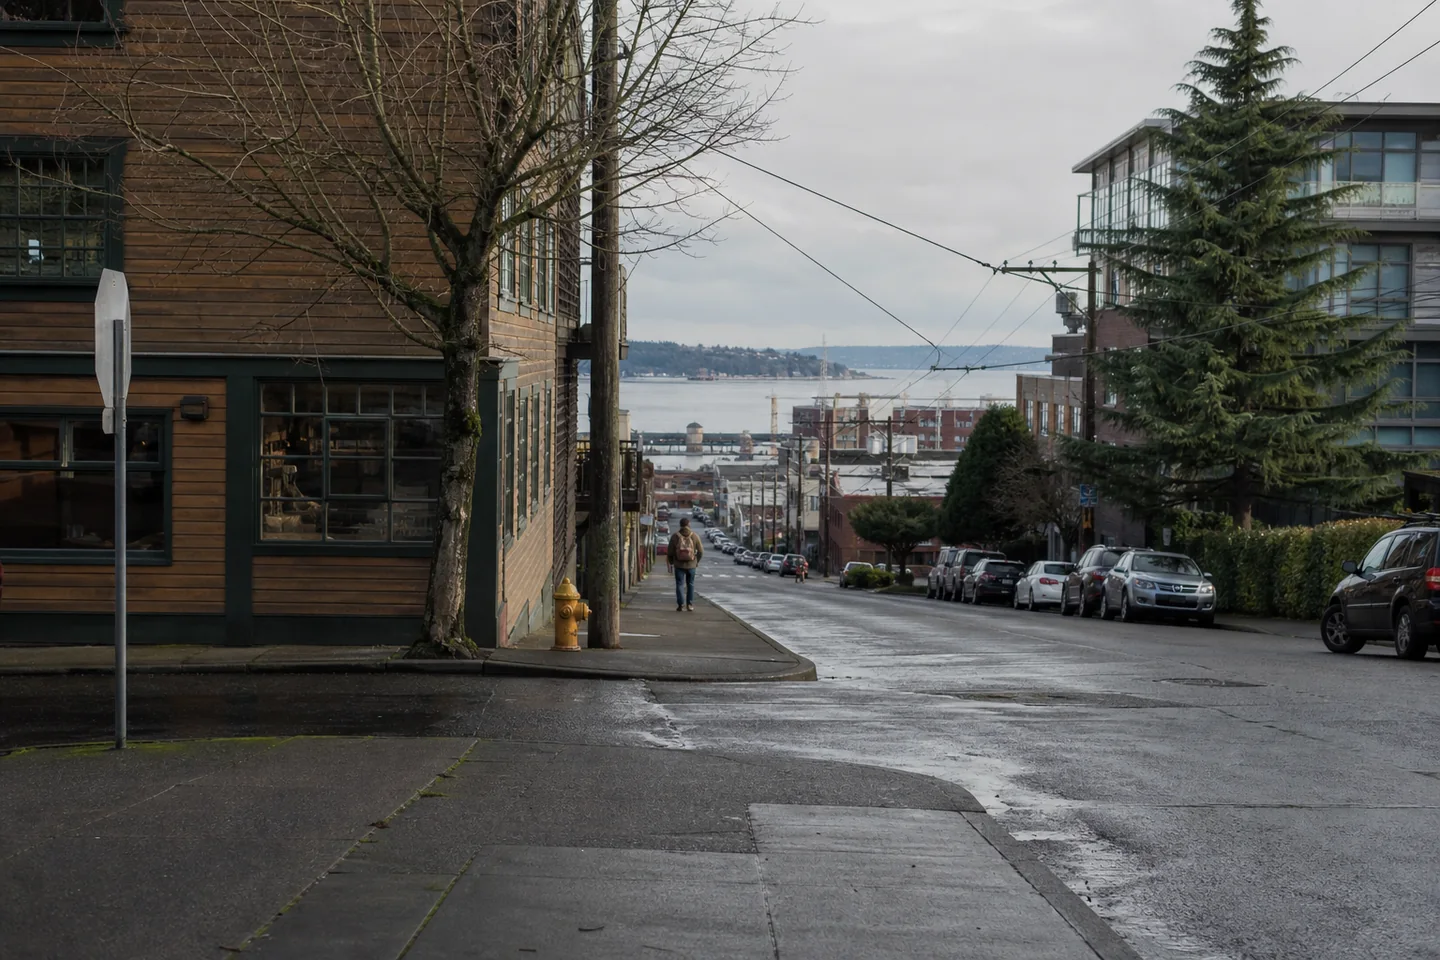
Puget Sound cities with materially different gross yield, entry cost, affordability, renter pressure and housing form despite their regional connection.
- Seattle
- $856k · 3.1% yield
- Tacoma
- $498k · 4.2% yield
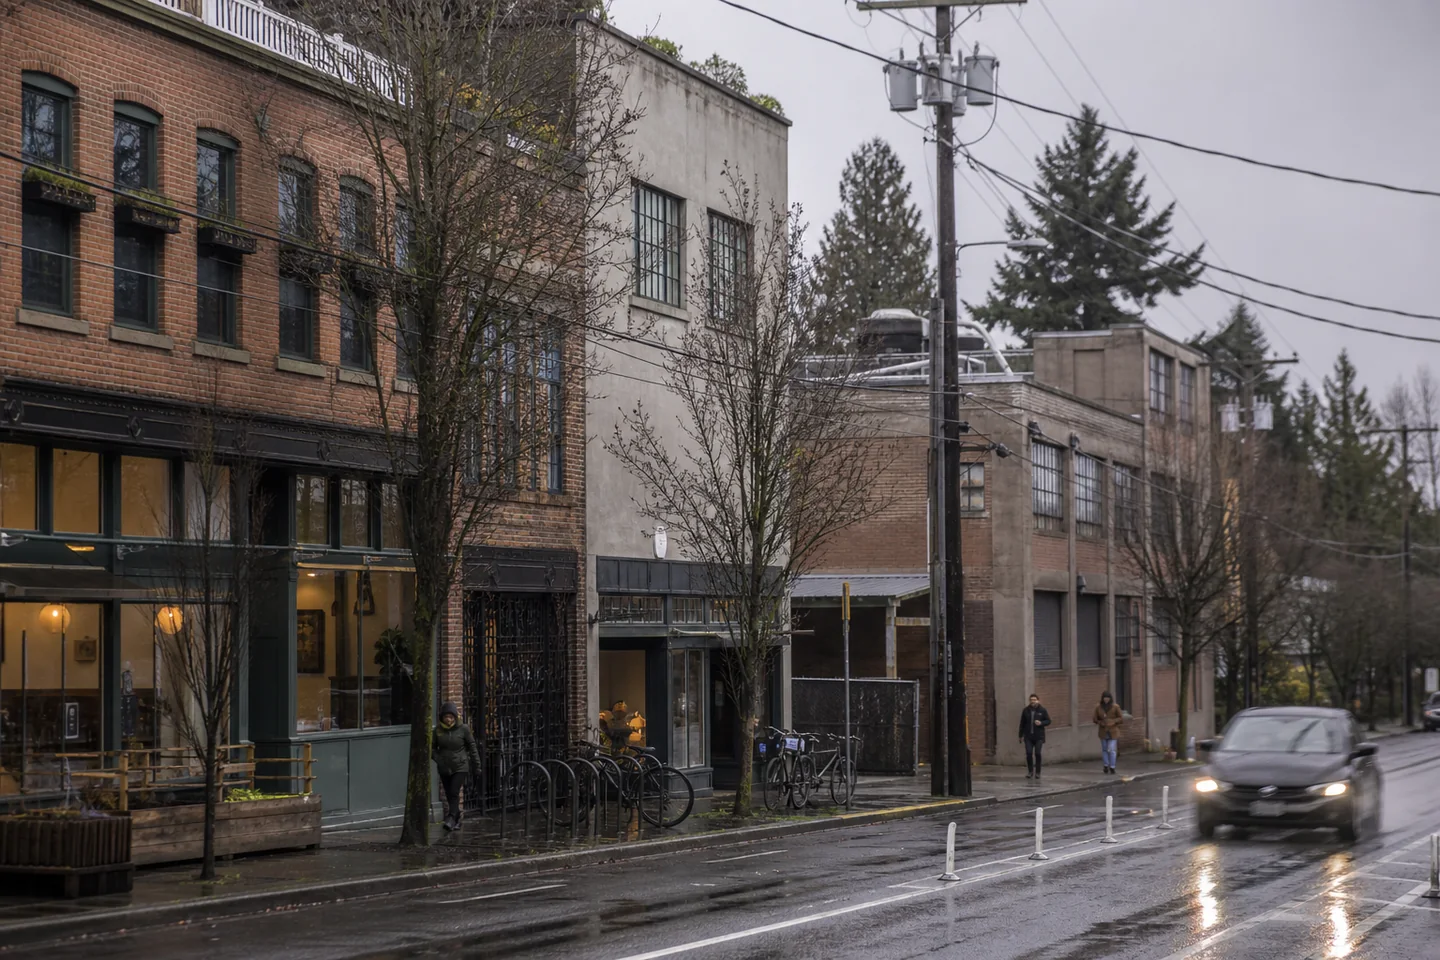

Oregon city alternatives whose entry price, housing stock and recent local demand evidence require different property screens.
- Portland
- $540k · 3.8% yield
- Salem
- $440k · 4.3% yield
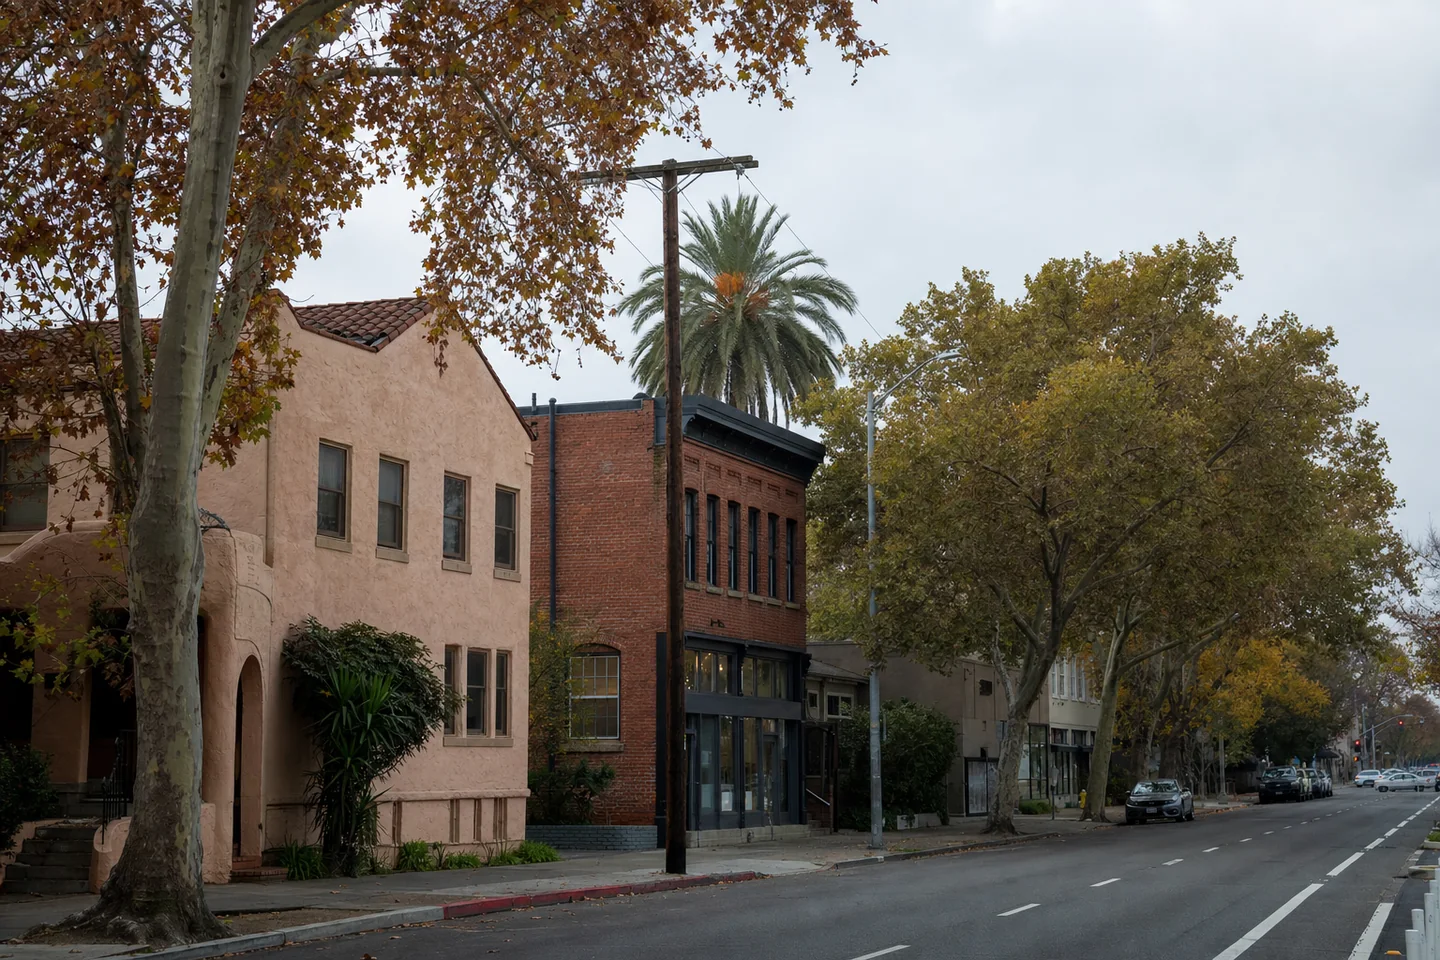
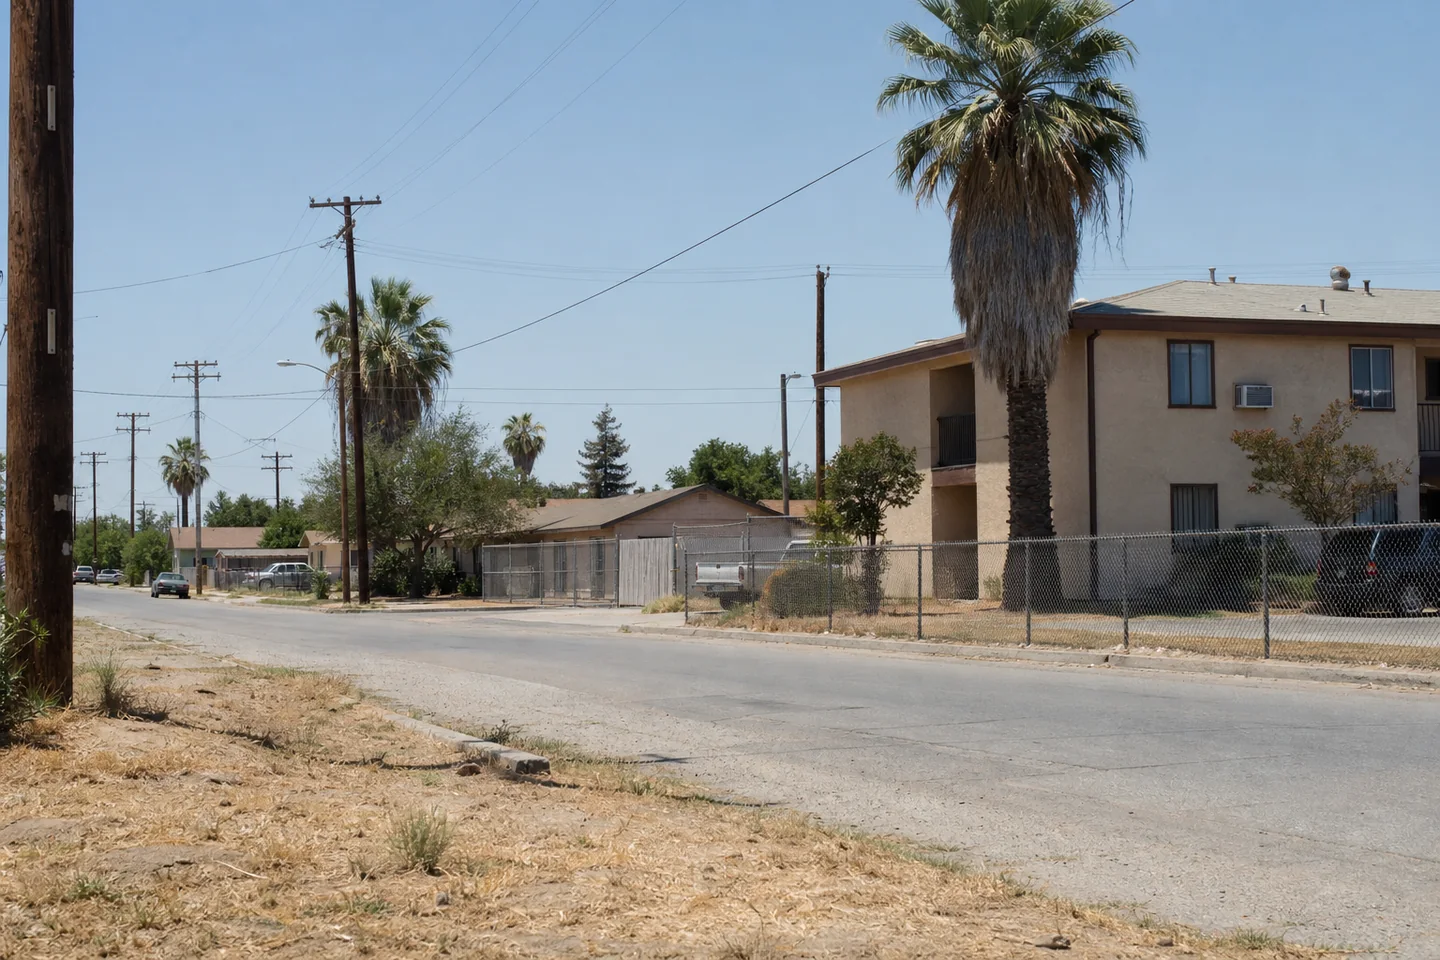
Inland California alternatives with material differences in entry price, gross yield, renter pressure and recent city demand evidence.
- Sacramento
- $483k · 5.1% yield
- Fresno
- $393k · 6.0% yield
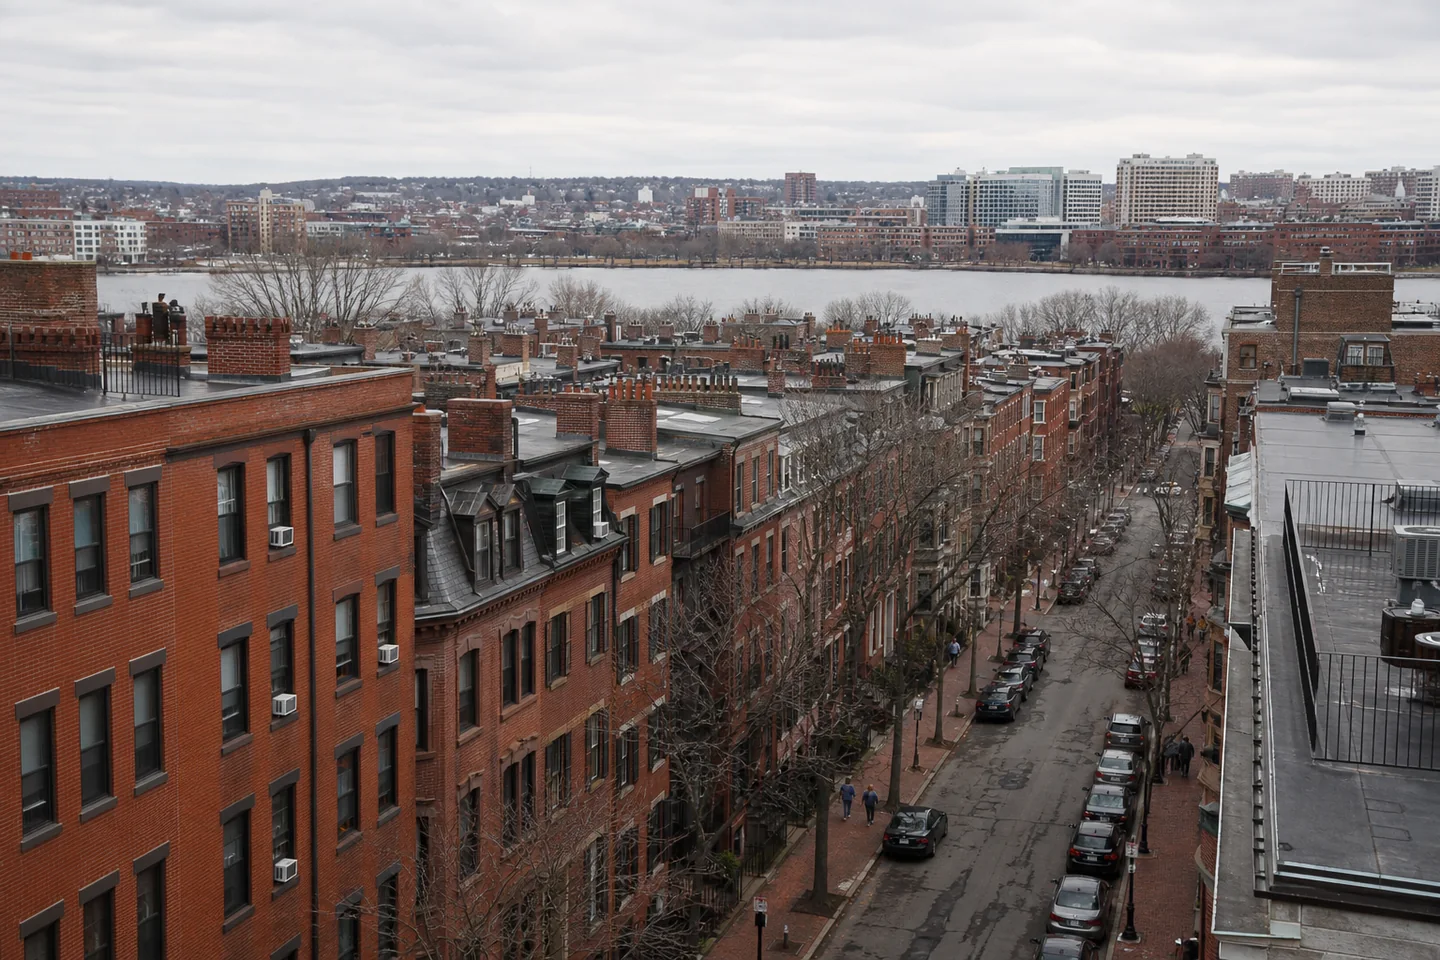
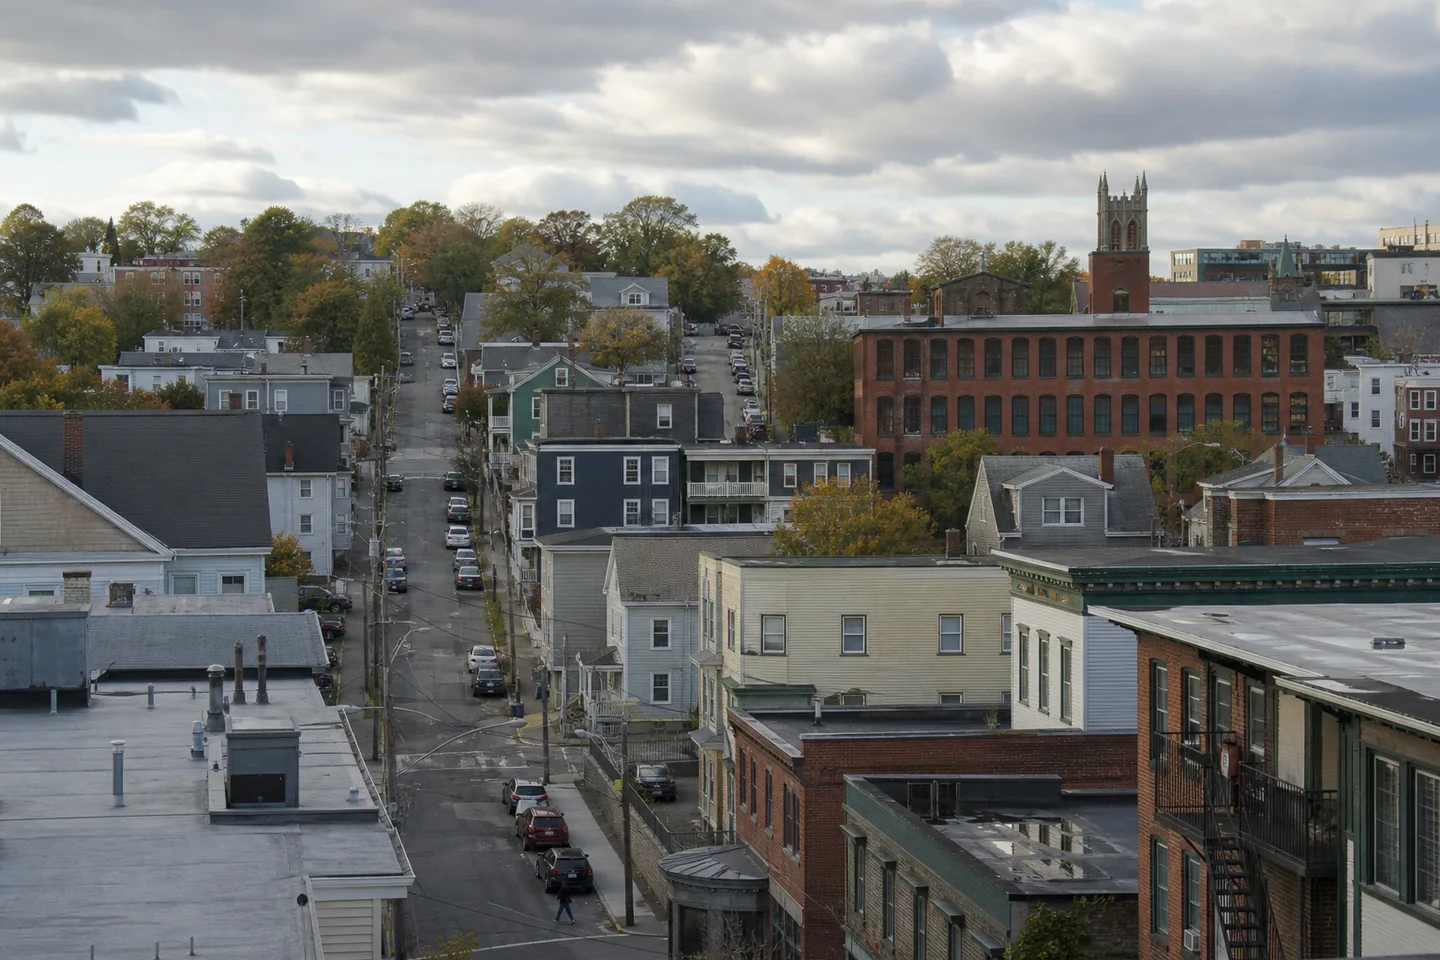
Massachusetts alternatives whose entry price, affordability, renter pressure, housing form and city demand records create separate search strategies.
- Boston
- $789k · 5.3% yield
- Worcester
- $443k · 5.9% yield

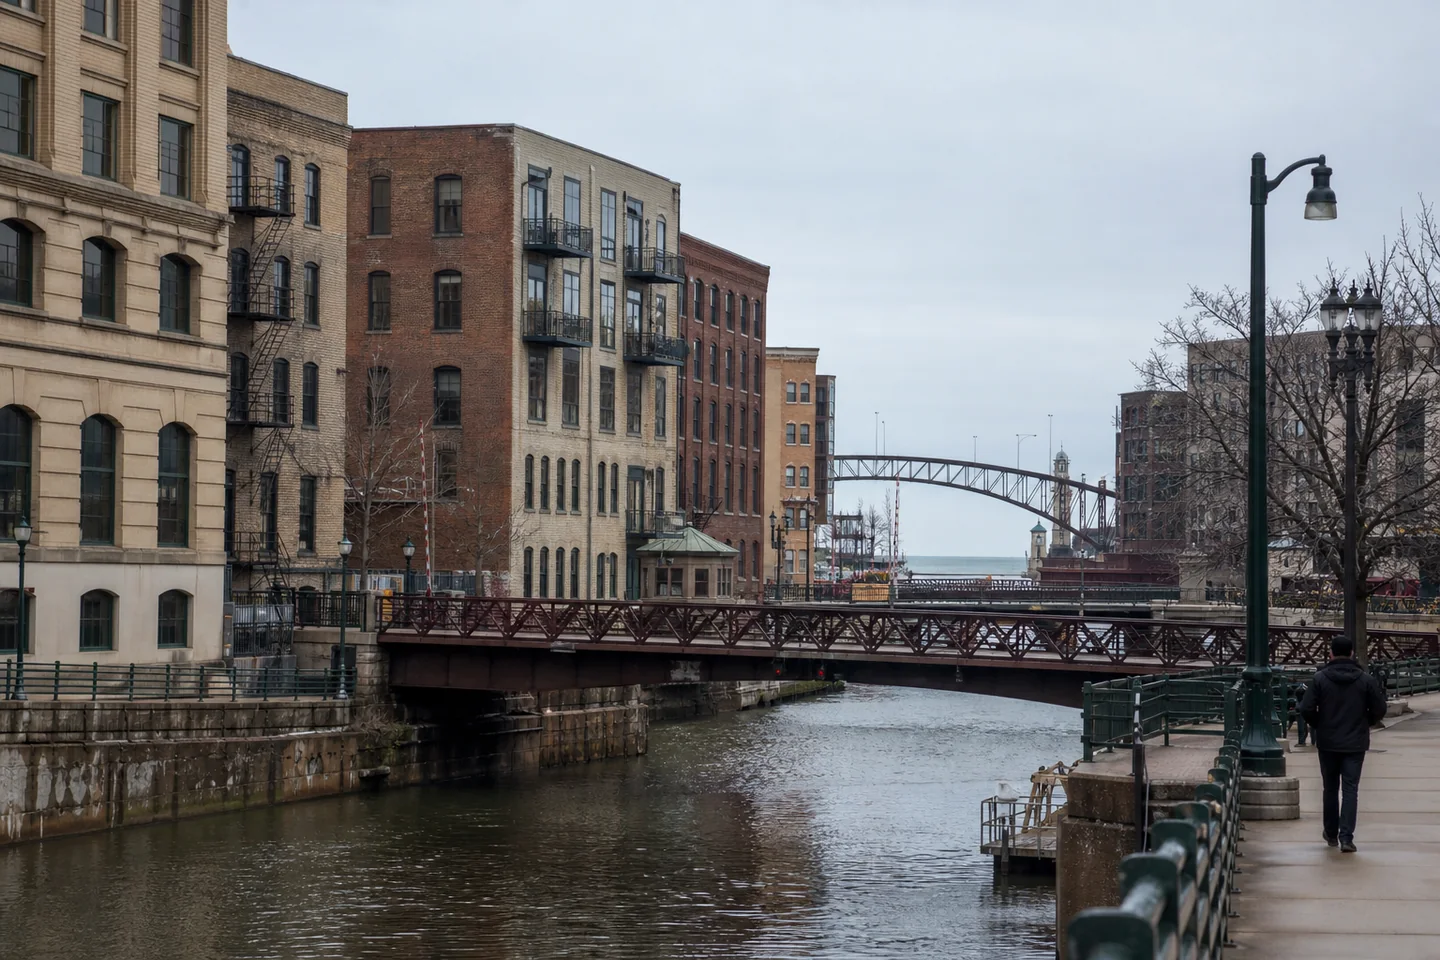
Wisconsin alternatives with large differences across acquisition cost, gross yield, affordability, renter pressure, housing form and local demand risk.
- Madison
- $435k · 4.6% yield
- Milwaukee
- $231k · 7.6% yield
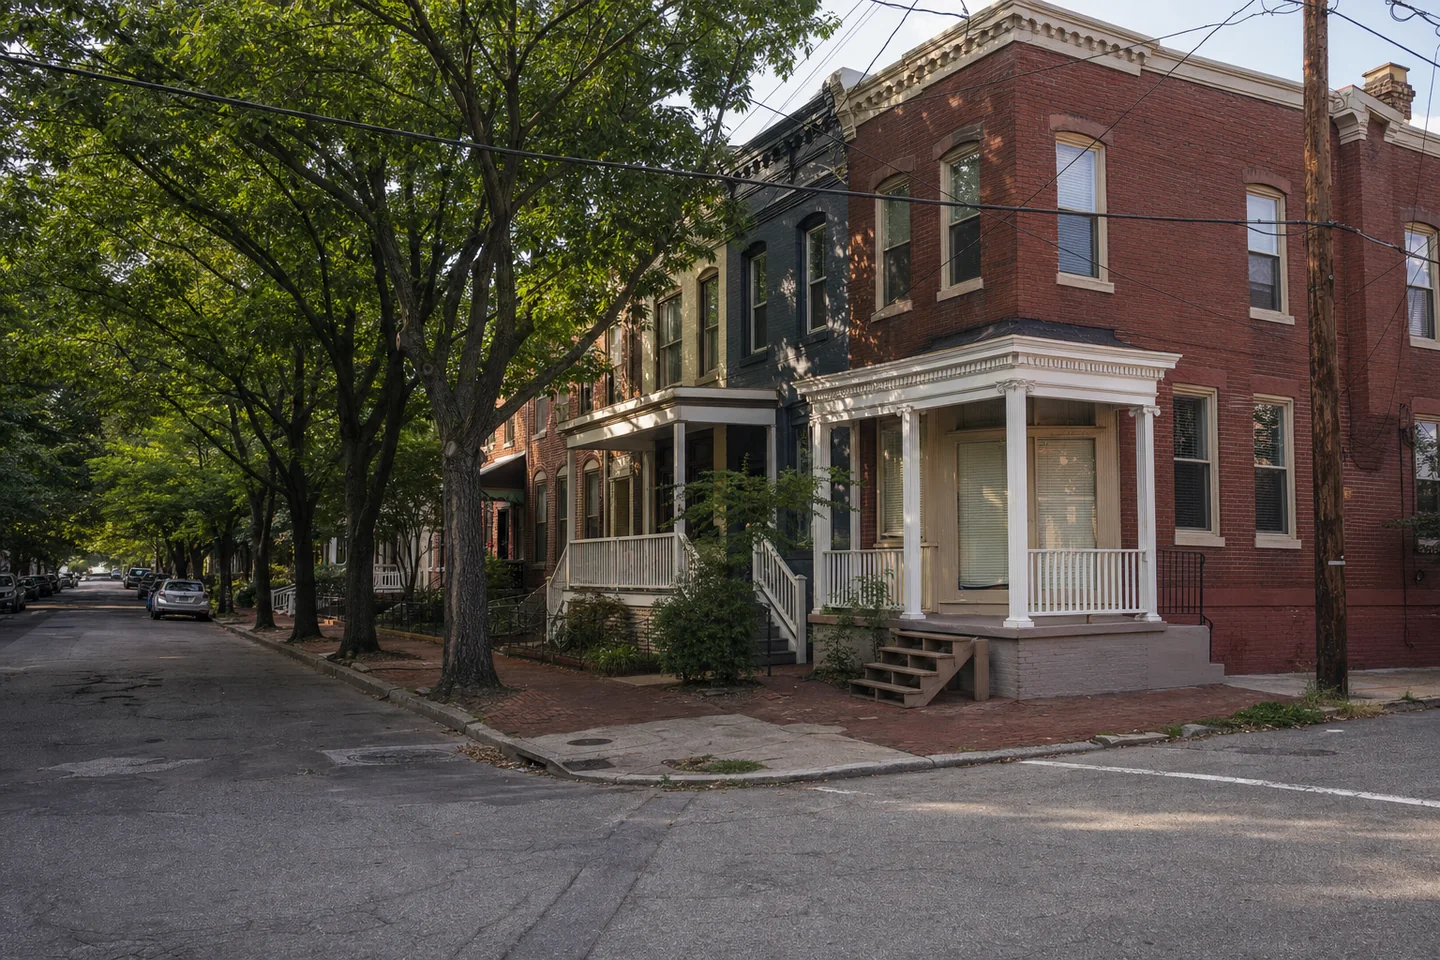
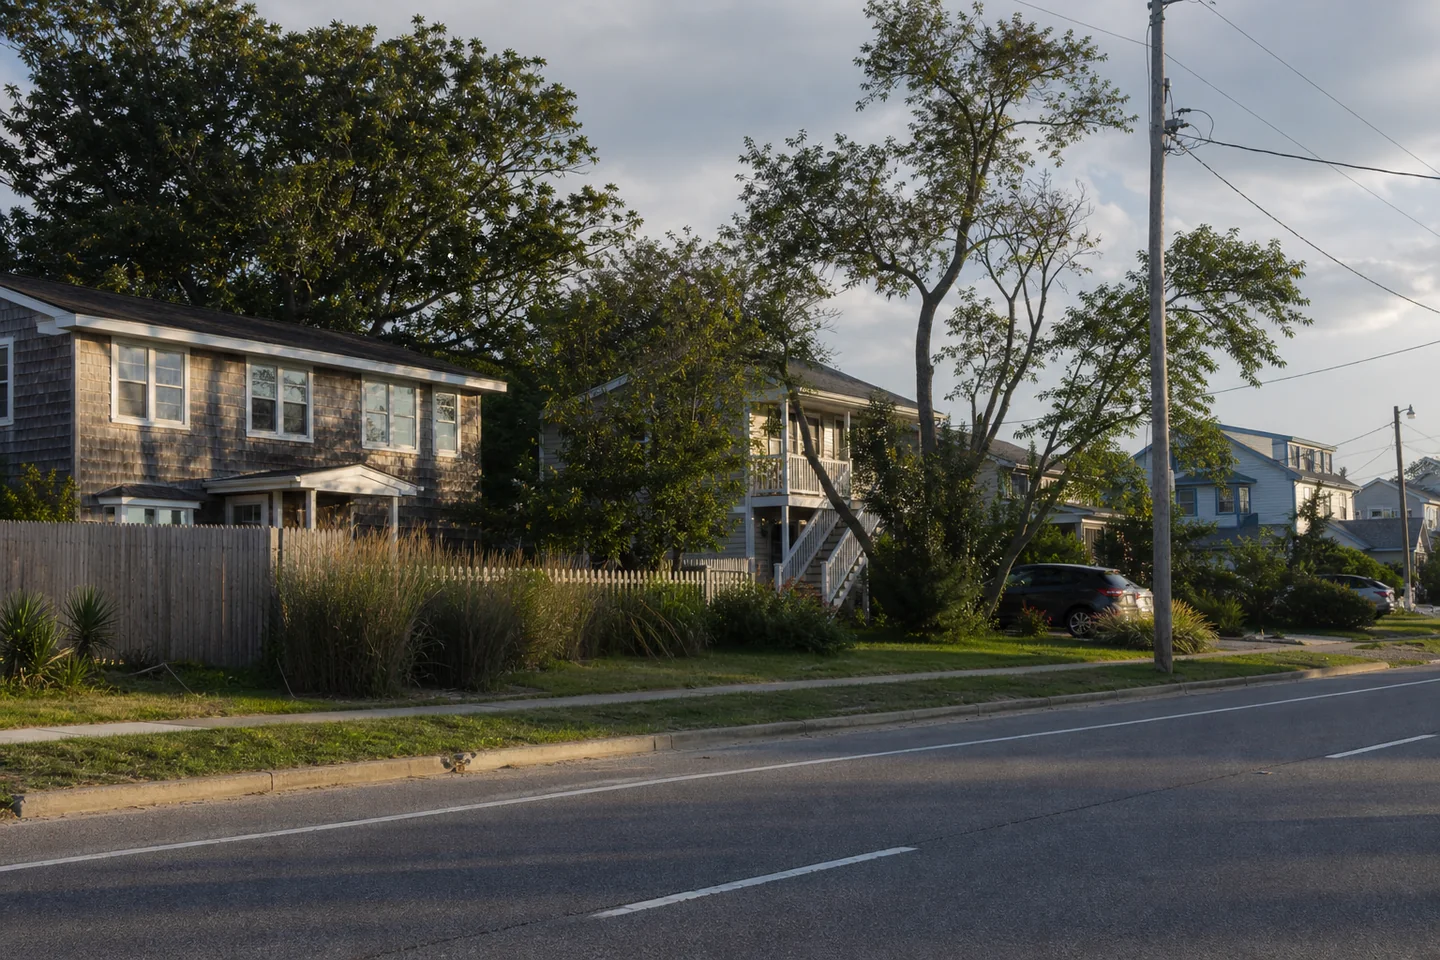
Virginia city alternatives with different buyer affordability, renter pressure, housing form and local-demand risk despite similar statewide context.
- Richmond
- $379k · 5.3% yield
- Virginia Beach
- $433k · 5.7% yield
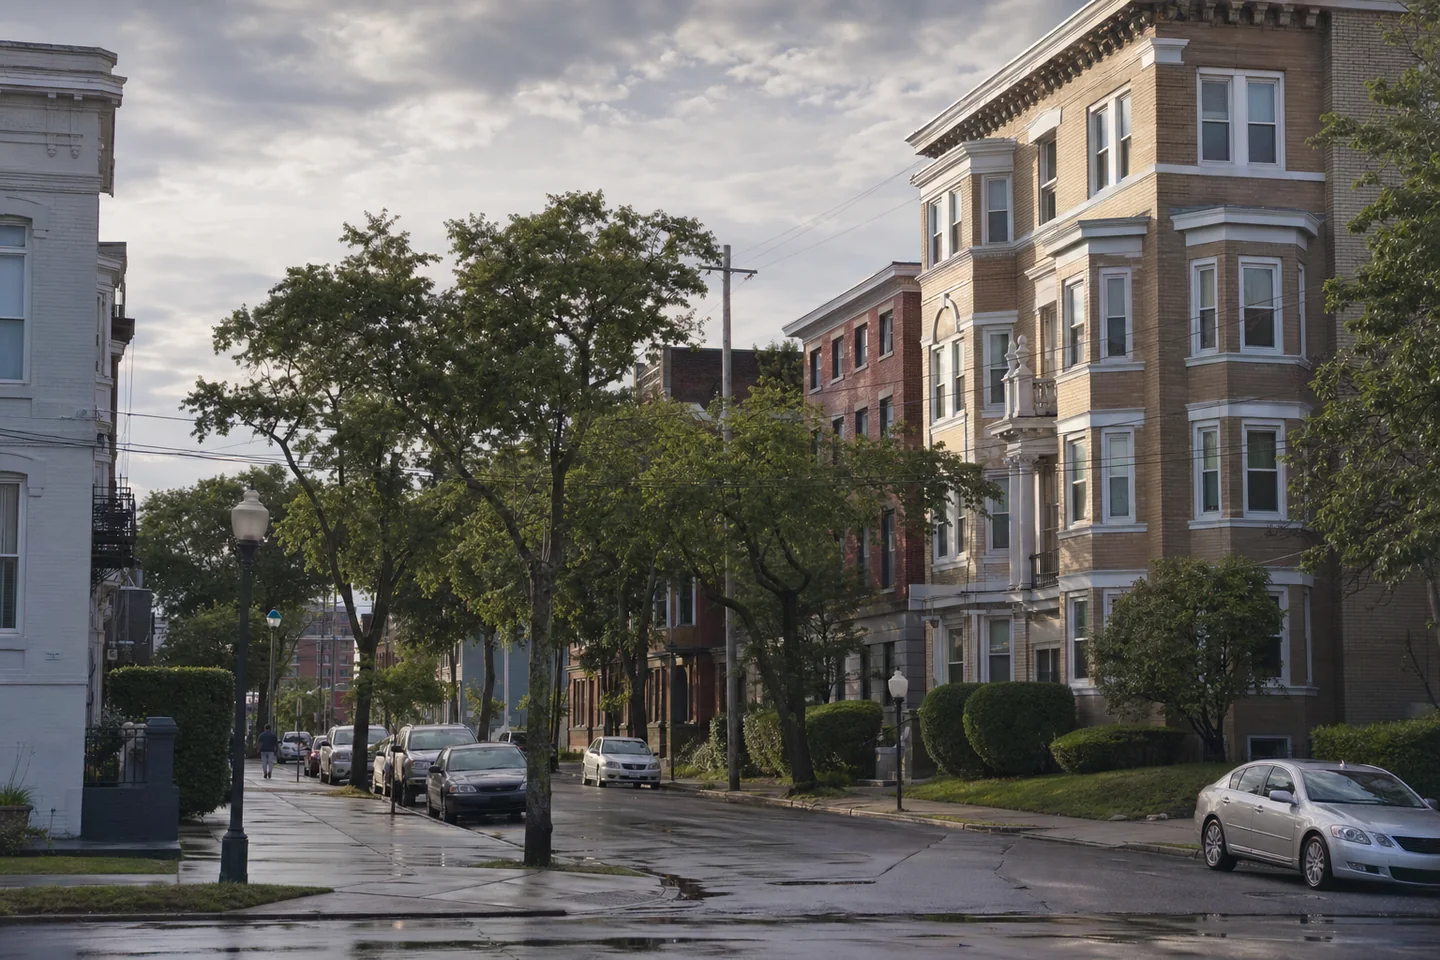
Neighboring Hampton Roads cities whose direct yield, entry cost, renter pressure, housing stock and demand records diverge materially.
- Virginia Beach
- $433k · 5.7% yield
- Norfolk
- $316k · 6.7% yield

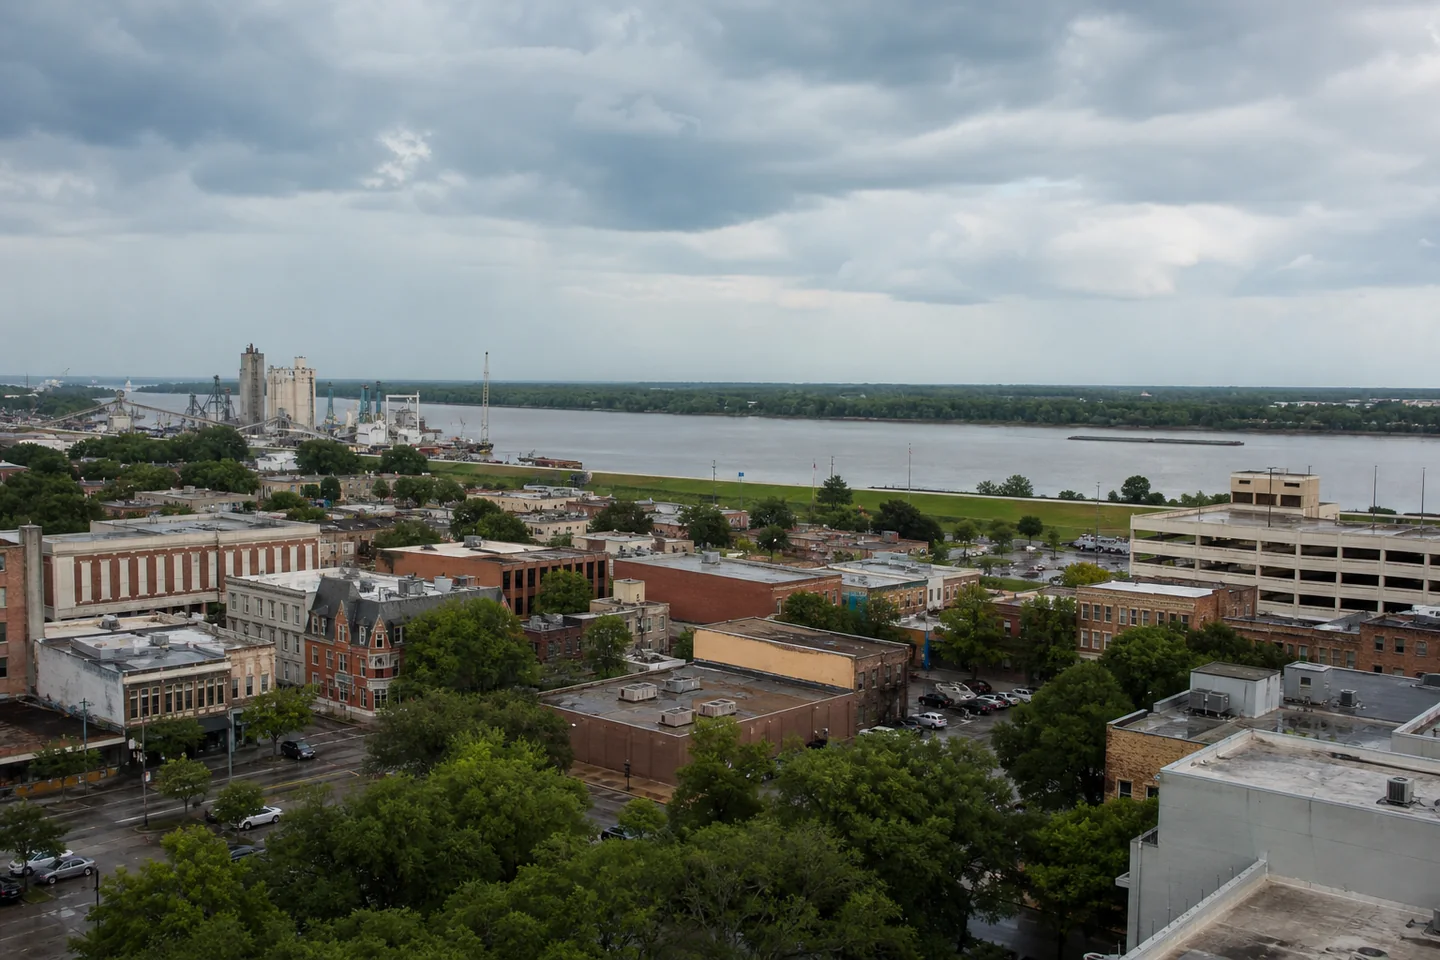
Louisiana's largest city alternatives with materially different gross-yield, housing-stock and local-demand evidence.
- New Orleans
- $248k · 8.1% yield
- Baton Rouge
- $233k · 7.1% yield
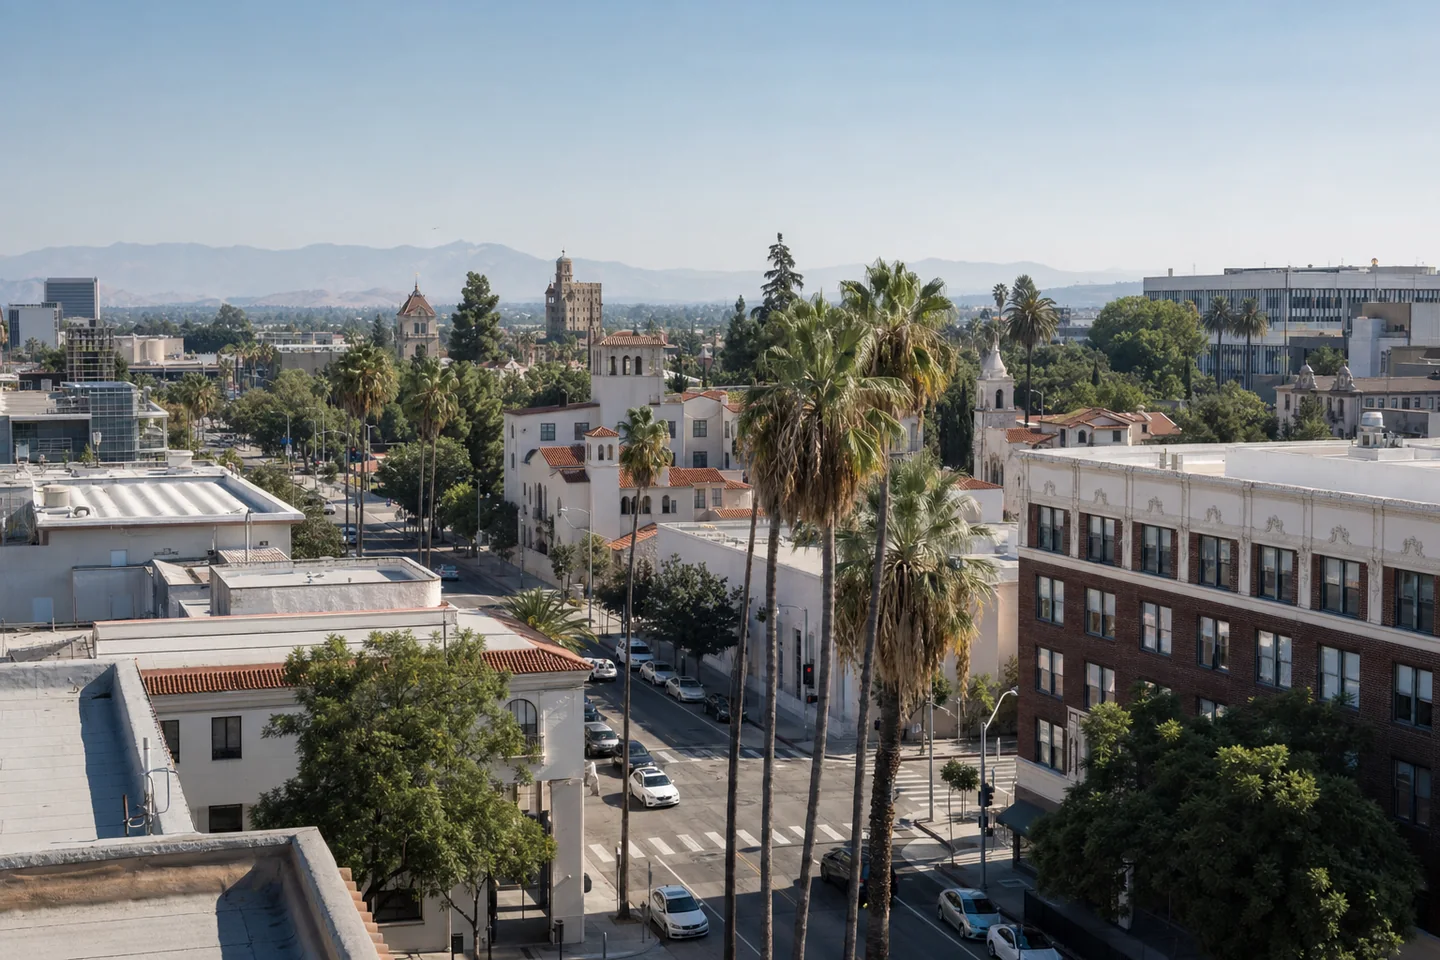

Adjacent Inland Empire cities with material differences in acquisition cost, renter pressure and recent local demand evidence.
- Riverside
- $648k · 4.5% yield
- San Bernardino
- $496k · 4.8% yield
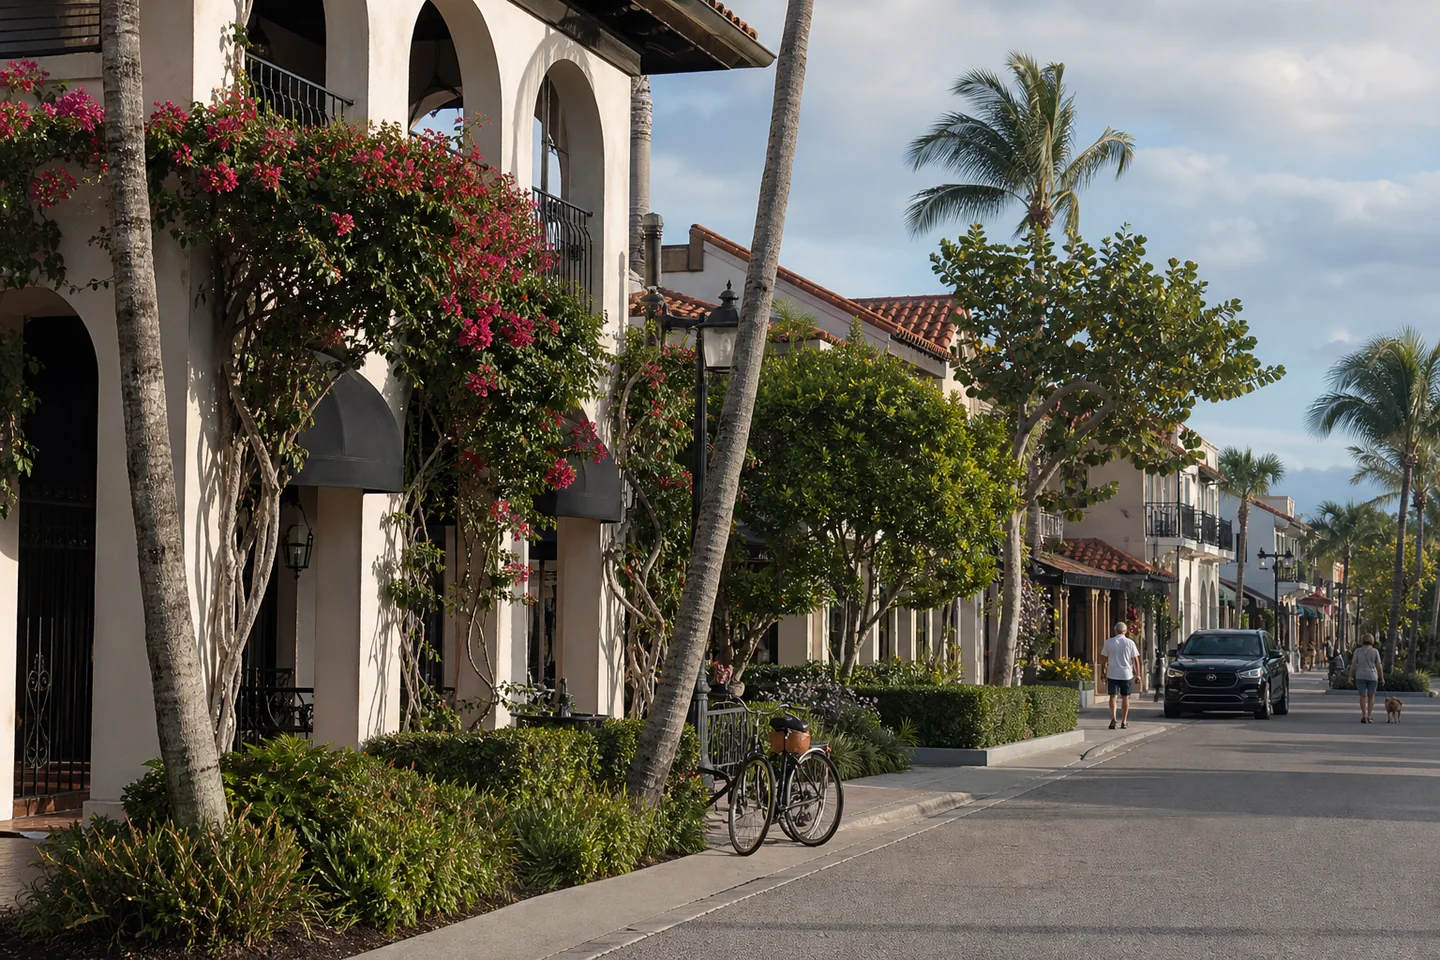

Gulf Coast cities with materially different entry cost, affordability, renter pressure, housing form and local demand risk.
- Naples
- $549k · 5.8% yield
- Sarasota
- $413k · 6.4% yield
Nearby New Jersey cities with distinct acquisition cost, affordability, renter pressure, housing stock and local demand risk.
- Newark
- $487k · 5.2% yield
- Jersey City
- $665k · 5.7% yield
Virginia city alternatives whose price, gross yield, buyer affordability, housing form and population evidence point to distinct property checks.
- Richmond
- $379k · 5.3% yield
- Norfolk
- $316k · 6.7% yield
Alabama's principal city alternatives with material differences across every selection signal, from yield and price to housing form and demand risk.
- Birmingham
- $140k · 11.7% yield
- Huntsville
- $293k · 5.4% yield


New Jersey city alternatives with similar population scale but material differences in entry price, affordability, renter pressure, housing form and local-demand risk.
- Toms River
- $471k · 7.1% yield
- Trenton
- $356k · 7.2% yield


North Georgia regional centers of similar scale whose direct city records create different yield, entry-cost, tenant-budget and housing-stock screens.
- Rome
- $236k · 6.6% yield
- Gainesville
- $376k · 5.2% yield
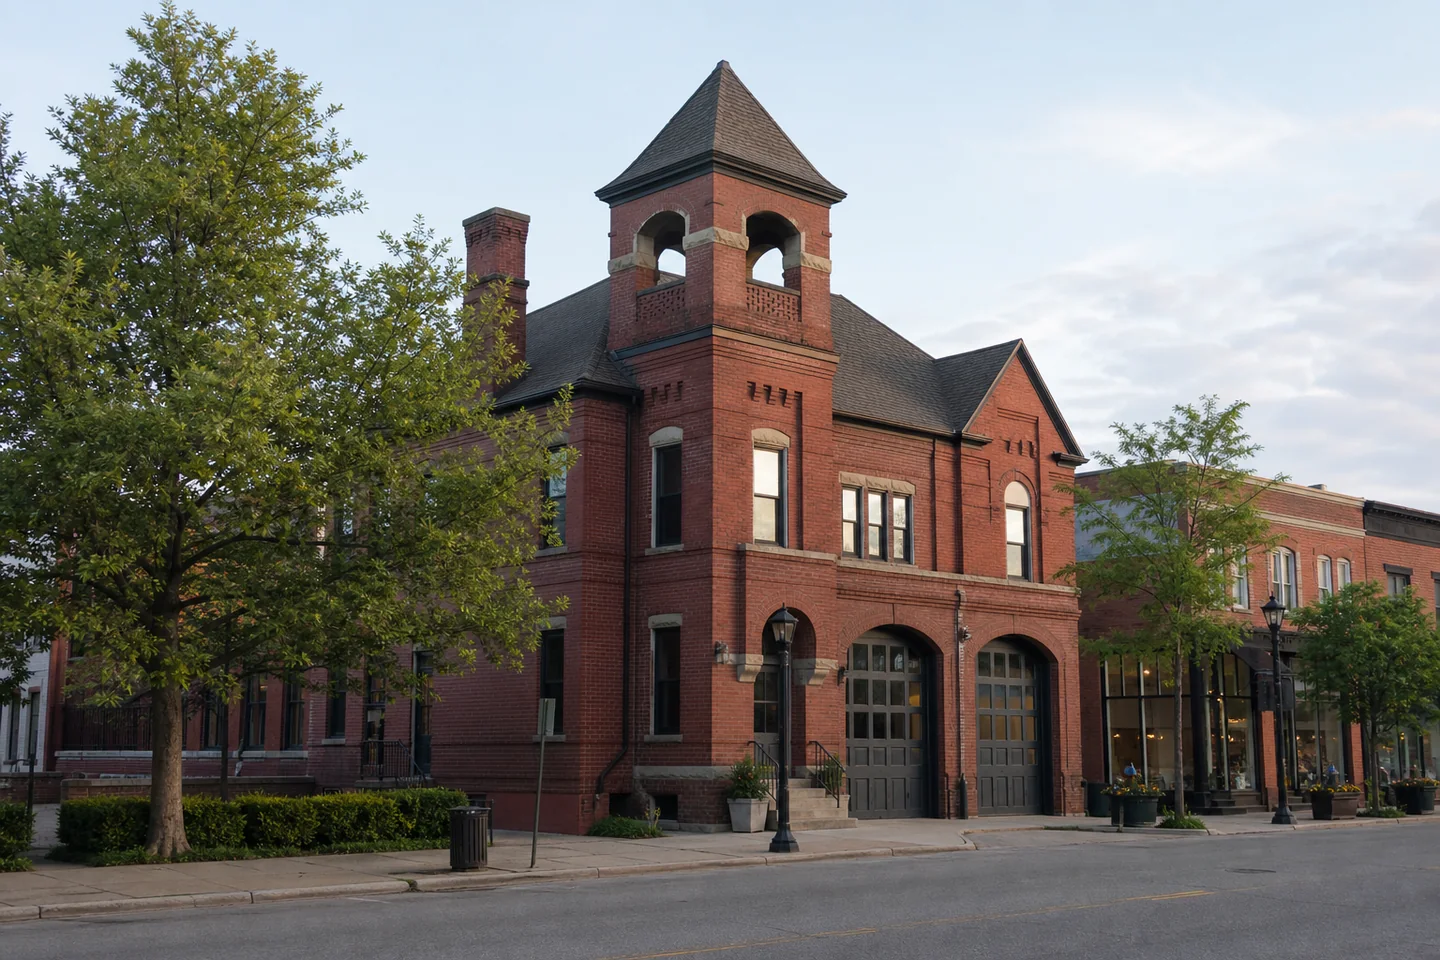
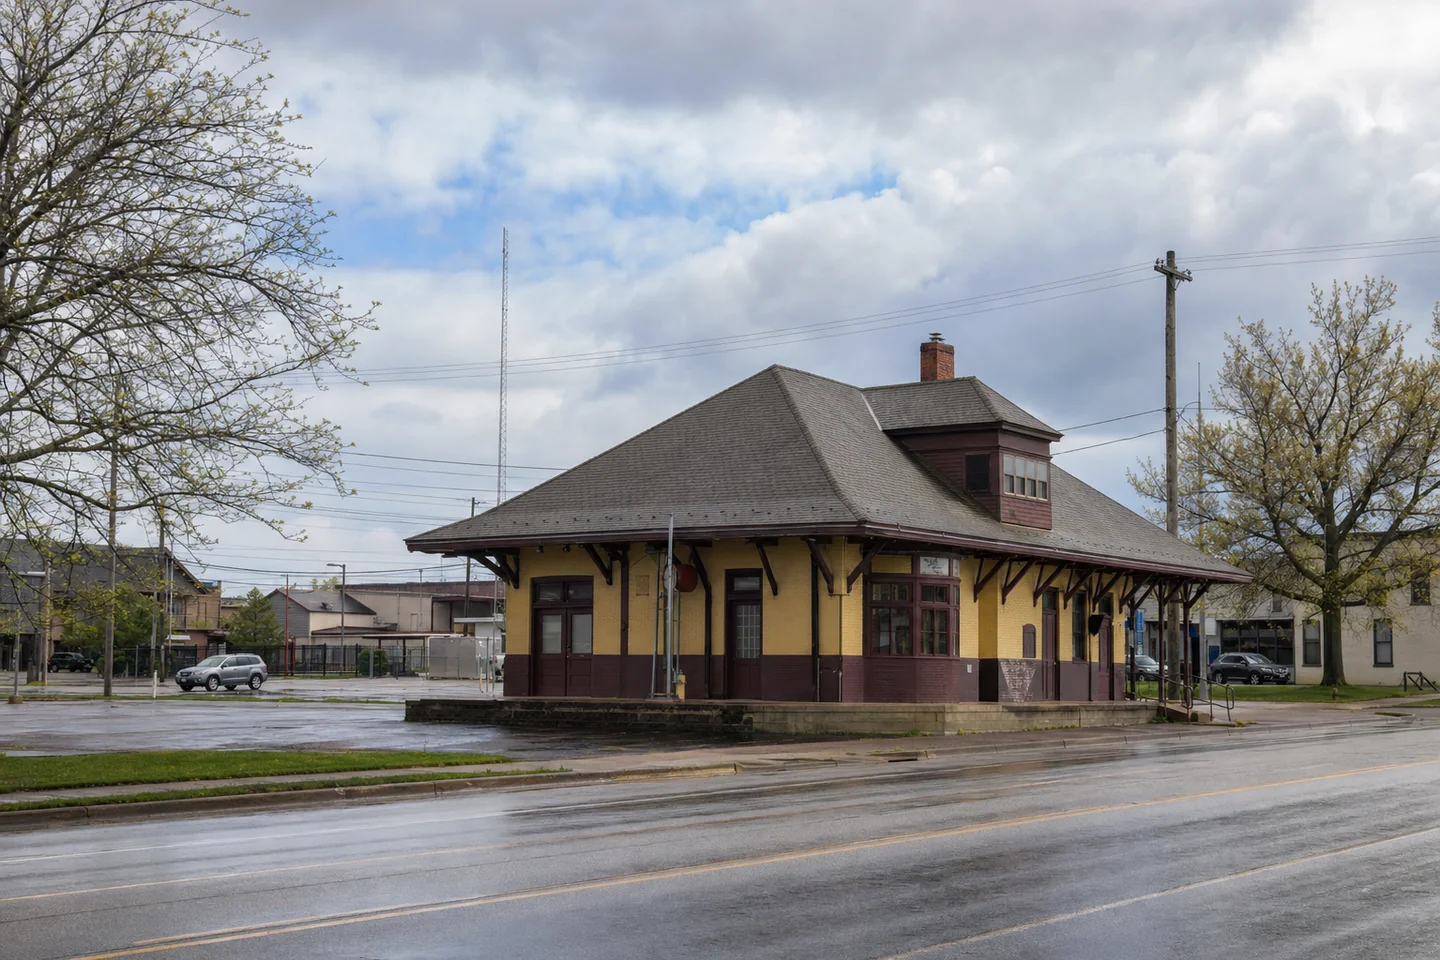
Michigan midsize city choices whose similarly sized populations mask material differences in price, yield, affordability, tenure, housing stock and demand risk.
- Holland
- $376k · 5.7% yield
- Saginaw
- $136k · 10.1% yield
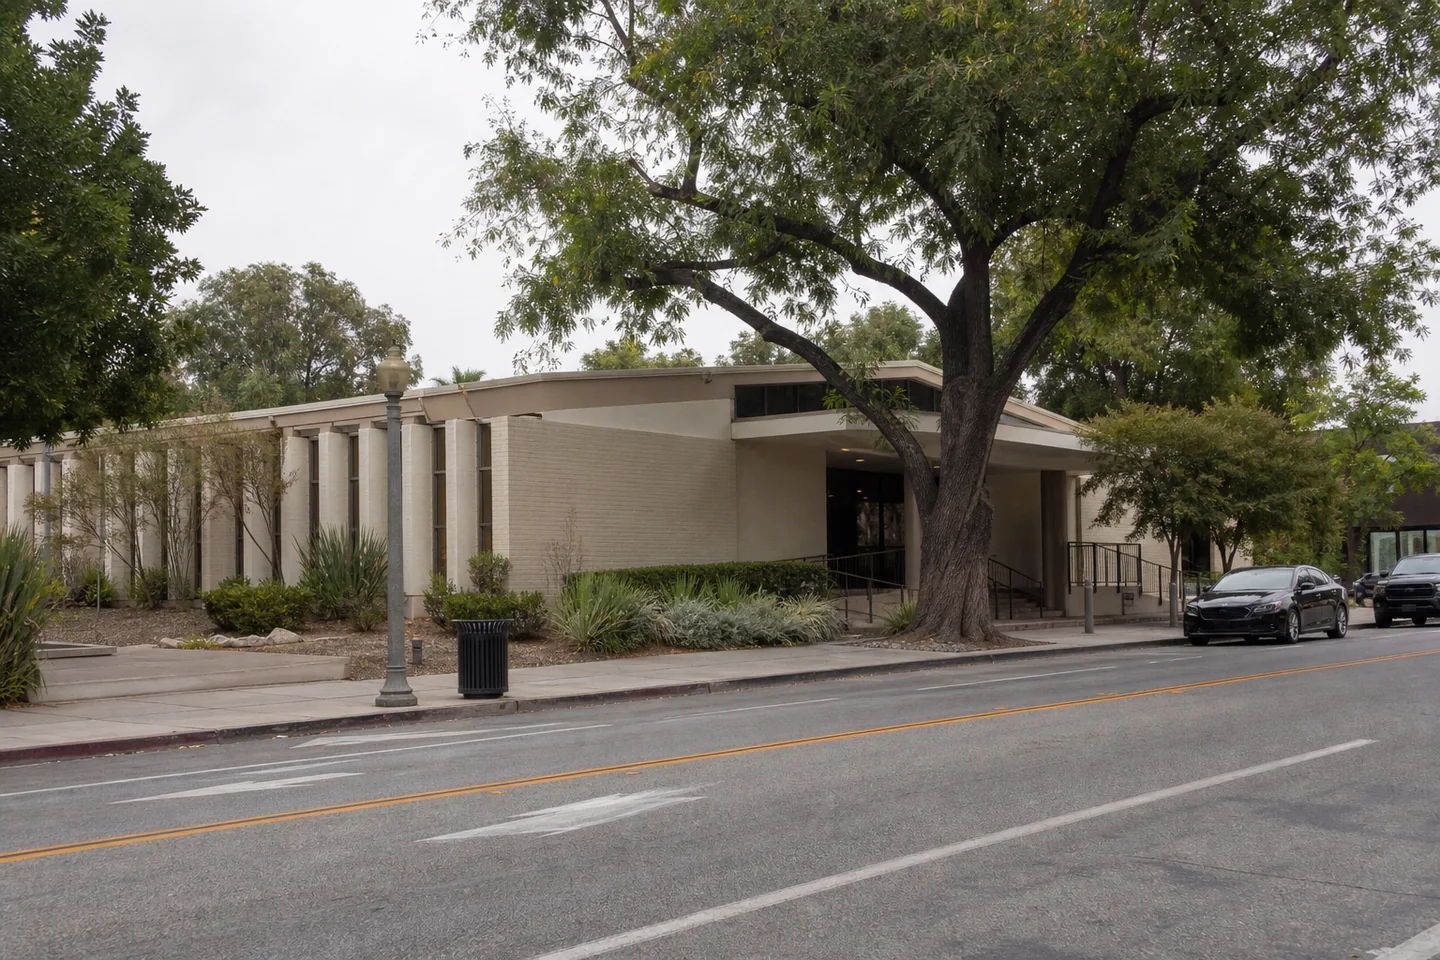
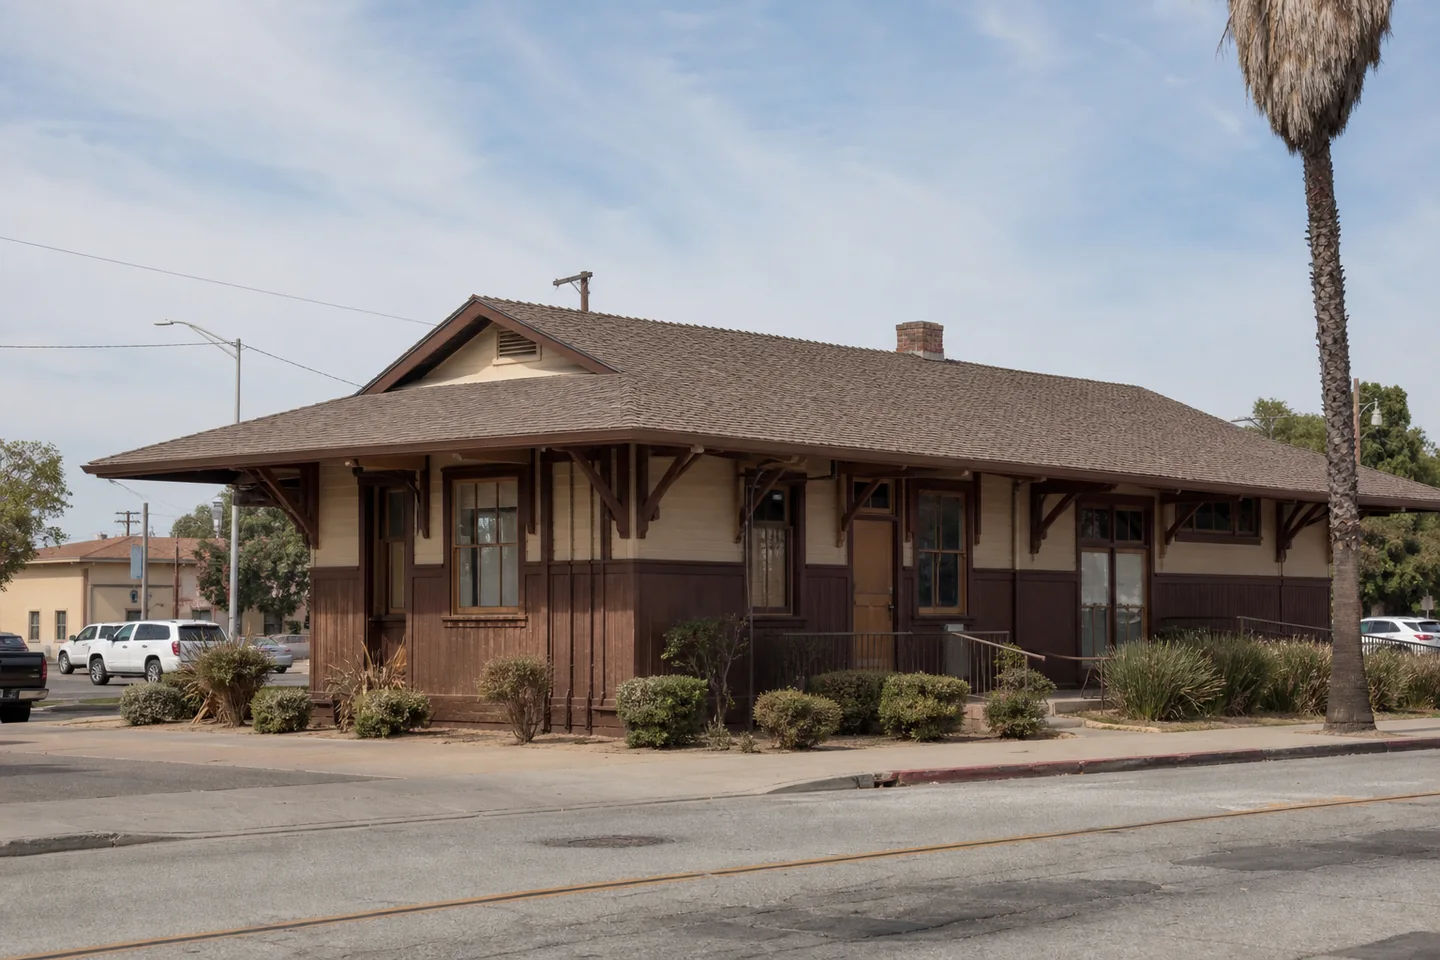
Two Inland Empire city choices with similar population scale but materially different entry price, yield, renter pressure, housing stock and local-demand evidence.
- Upland
- $823k · 3.5% yield
- Perris
- $545k · 6.2% yield
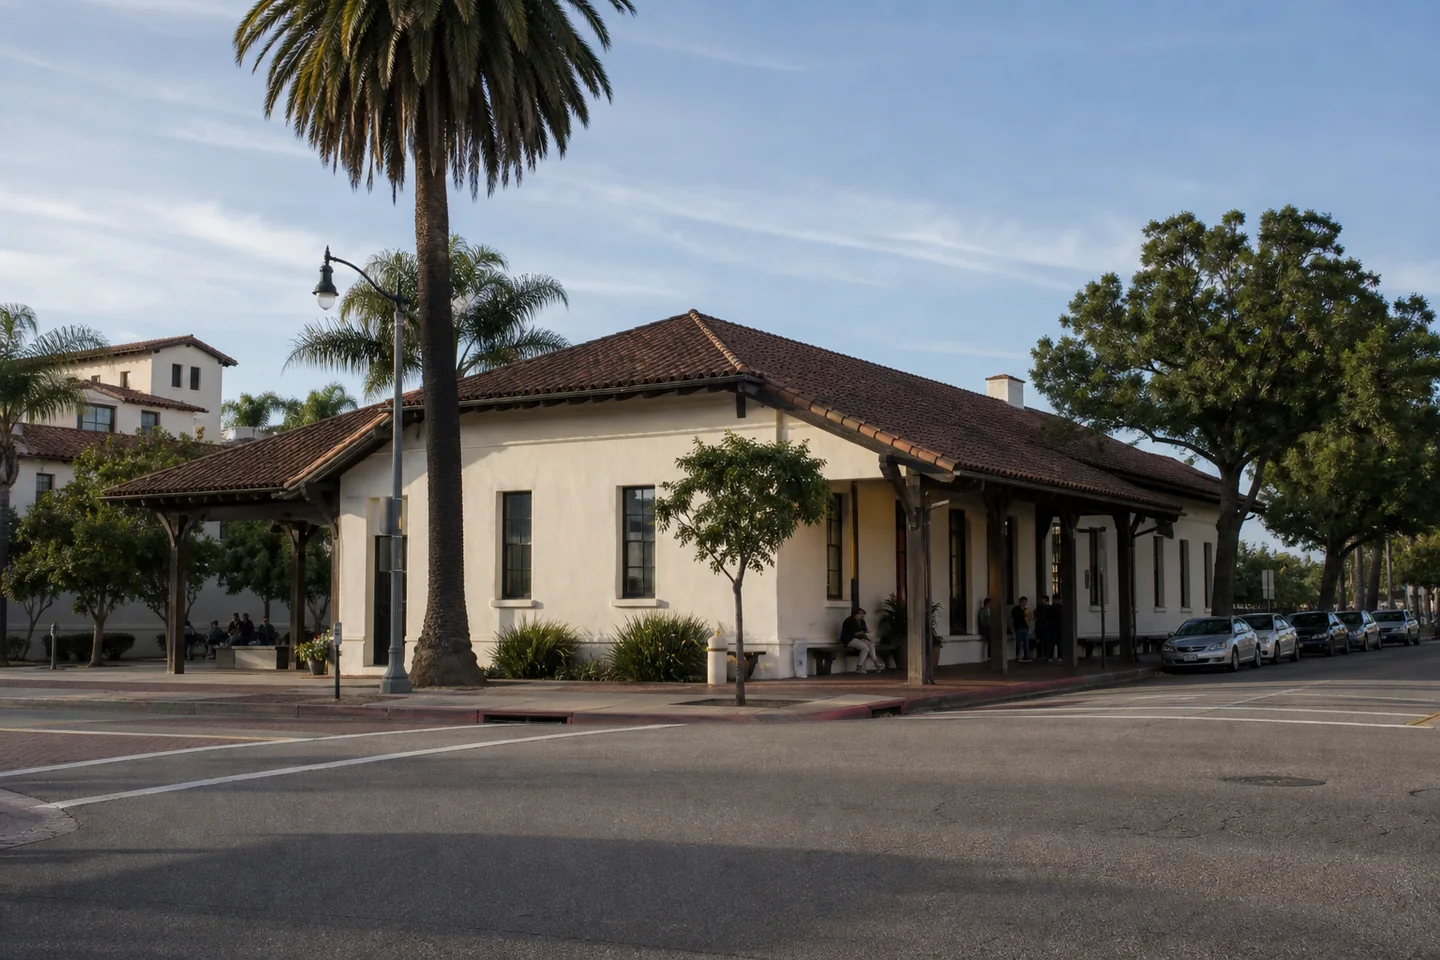

High-cost California city alternatives with materially different buyer-affordability, renter-pressure, housing-stock and local-demand evidence.
- Santa Barbara
- $1835k · 2.6% yield
- Redwood City
- $1885k · 2.5% yield


Two inland California city alternatives with similar population scale but materially different gross-yield, renter-pressure, housing-stock and local-demand evidence.
- Redding
- $395k · 5.0% yield
- Merced
- $398k · 5.9% yield


Pennsylvania county-seat markets of similar population scale with sharply different entry cost, rent relationship, renter pressure, housing stock and local-demand evidence.
- Chambersburg
- $293k · 5.5% yield
- West Chester
- $677k · 3.9% yield


North Carolina employment and education centers with materially different entry price, yield, affordability, renter pressure, housing stock and demand evidence.
- Hickory
- $301k · 5.8% yield
- Chapel Hill
- $642k · 3.3% yield


Northwest and western Arkansas alternatives that diverge materially across all six direct-city investment screens.
- Fayetteville
- $385k · 5.4% yield
- Fort Smith
- $197k · 6.5% yield
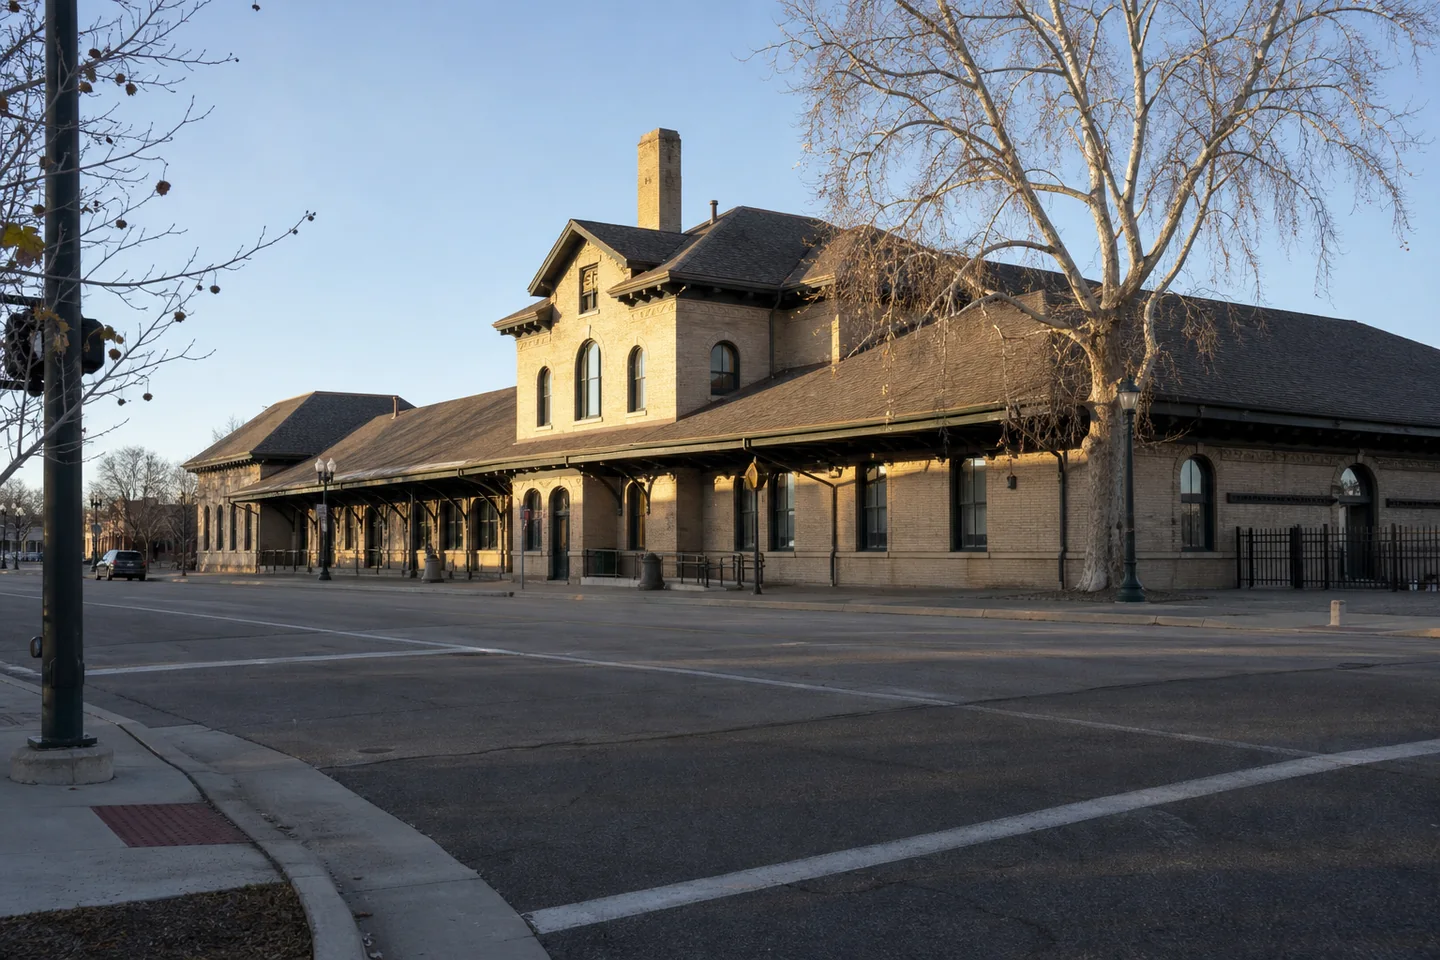

Nearby northern Utah alternatives with materially different entry price, housing-stock structure and recent local-demand evidence.
- Ogden
- $402k · 3.9% yield
- Layton
- $530k · 3.7% yield
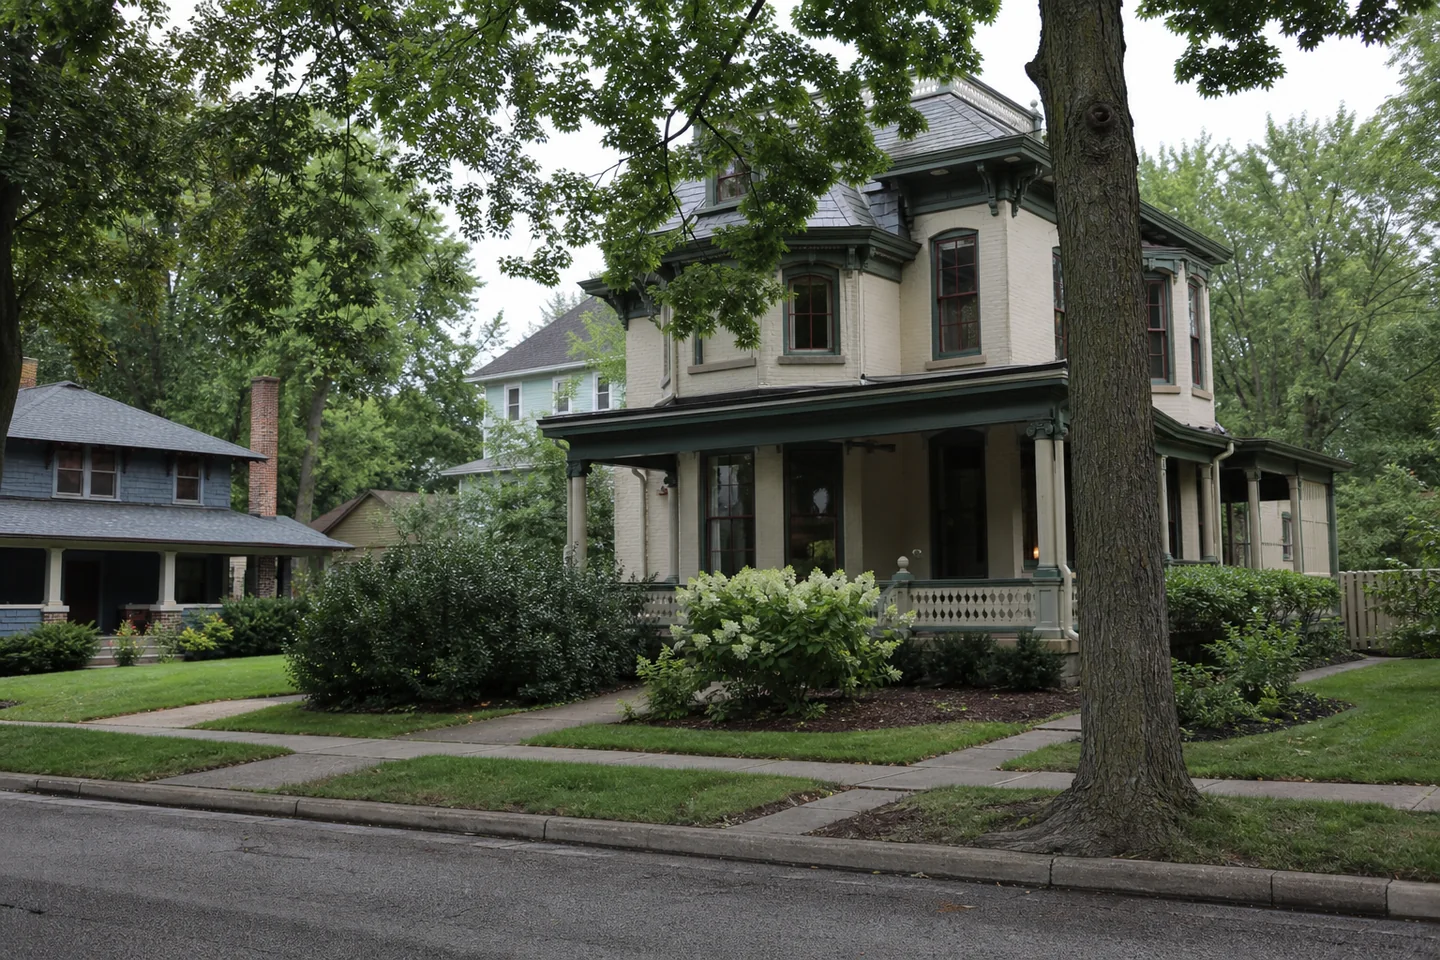
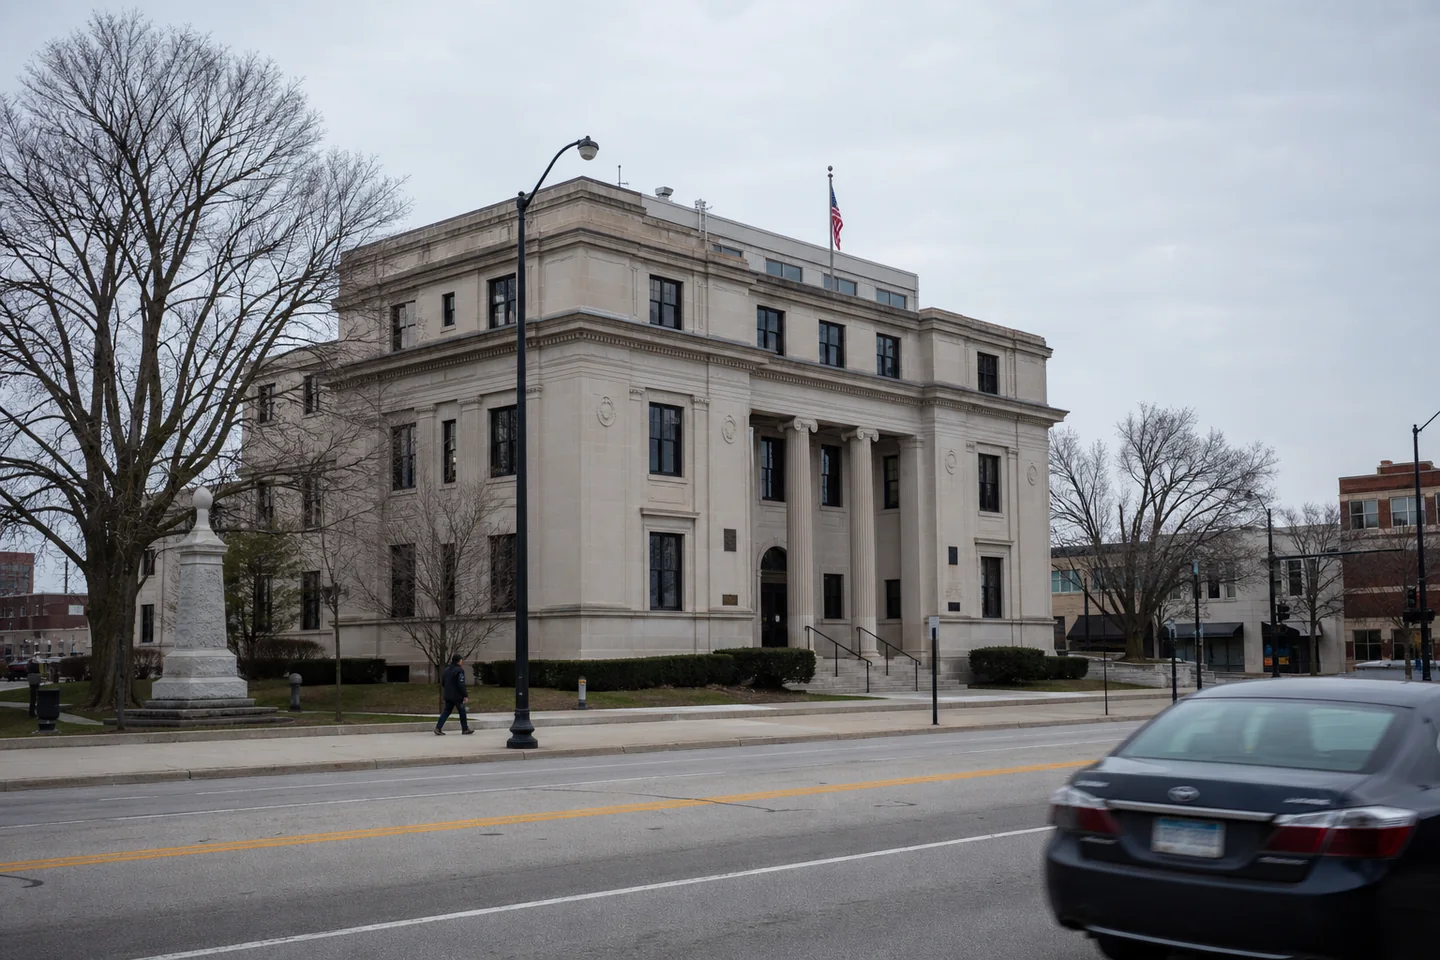
Indiana employment and education centers with materially different acquisition cost, gross-yield screen, renter pressure, housing form and demand evidence.
- West Lafayette
- $375k · 5.9% yield
- Terre Haute
- $164k · 7.3% yield
Massachusetts city alternatives with comparable population scale and materially different acquisition cost, affordability, renter pressure, housing form and demand risk.
- Framingham
- $682k · 4.2% yield
- Lawrence
- $522k · 5.4% yield


Western Washington city alternatives with different price points, yield screens, renter budgets, housing form and local-demand constraints.
- Olympia
- $539k · 4.5% yield
- Kirkland
- $1227k · 2.6% yield


Mid-sized Wisconsin alternatives whose direct city records differ materially on gross yield, entry price, housing stock and local-demand risk.
- Oshkosh
- $263k · 5.5% yield
- Eau Claire
- $322k · 4.5% yield
South Florida coastal alternatives that separate materially on all six city-level underwriting lenses, including yield, entry price and renter pressure.
- Miami Beach
- $525k · 6.8% yield
- Deerfield Beach
- $273k · 10.7% yield


Arkansas growth-market alternatives with material differences in yield, entry price, renter pressure, housing form and recent local-demand evidence.
- Rogers
- $388k · 4.6% yield
- Conway
- $252k · 6.8% yield


Montana city alternatives with sharply different entry cost, gross yield, affordability, renter pressure, housing stock and demand evidence.
- Bozeman
- $734k · 3.6% yield
- Great Falls
- $343k · 4.8% yield


Rhode Island city alternatives with similar population scale and materially different affordability, renter-pressure, housing-stock and local-demand evidence.
- Warwick
- $429k · 6.2% yield
- Pawtucket
- $405k · 5.5% yield
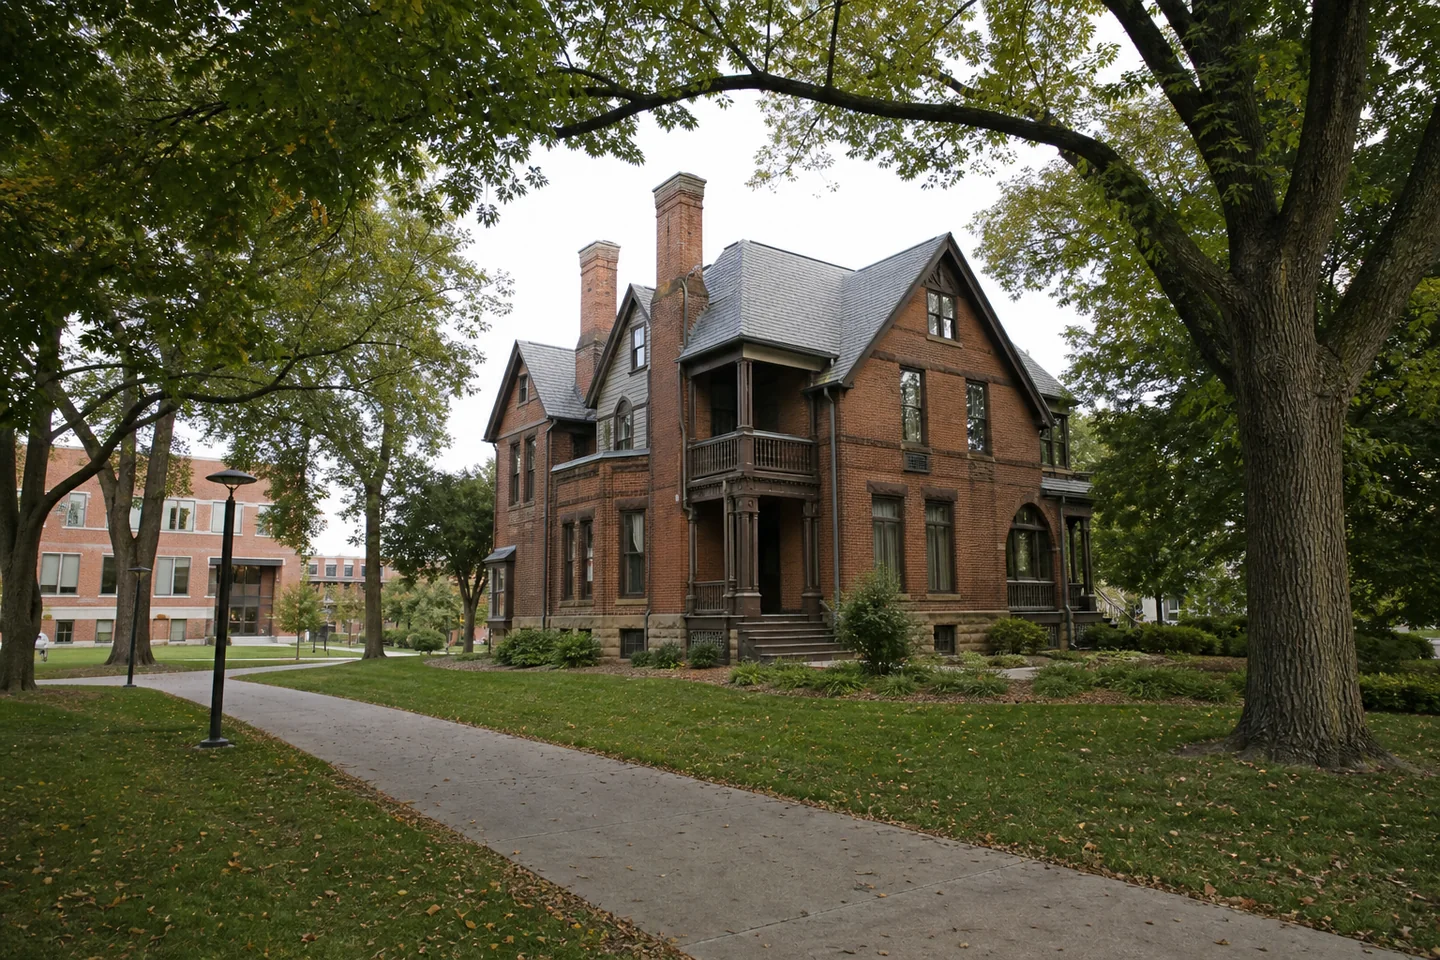

Central Iowa alternatives with comparable population scale but different buyer-affordability, renter-pressure, housing-stock and local-demand records.
- Ames
- $308k · 4.4% yield
- West Des Moines
- $327k · 5.0% yield


Oklahoma city alternatives with similar population scale but material differences across all six direct-city underwriting lenses.
- Enid
- $139k · 10.9% yield
- Stillwater
- $272k · 6.3% yield
Compare nearby choices without treating the metro as the city.
These pairs support relocation and acquisition decisions between recognizable alternatives in the same broader region.
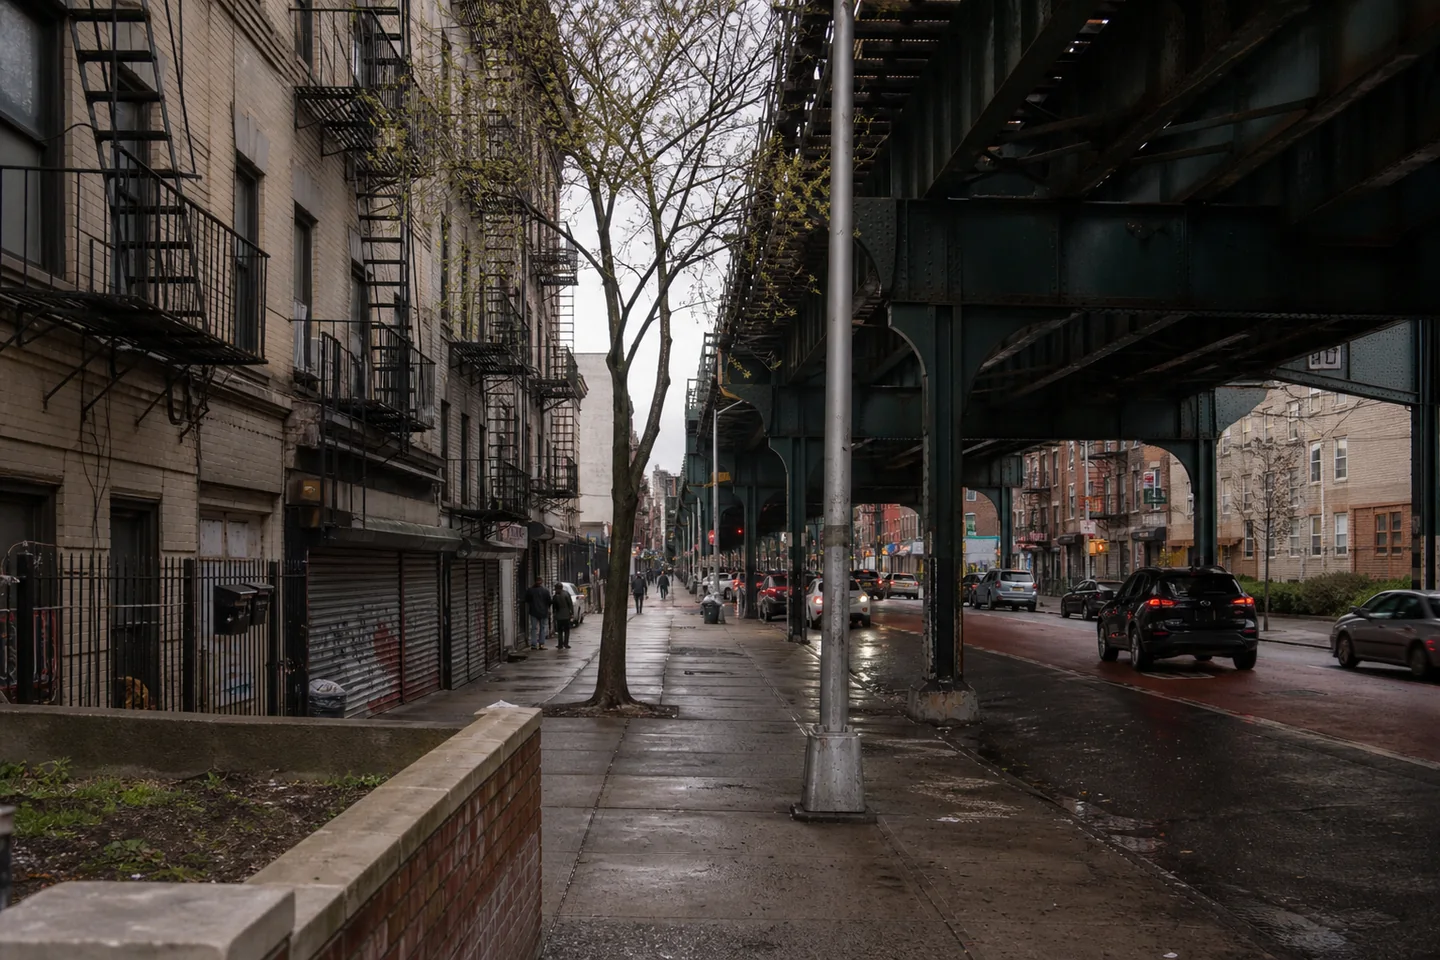
High-cost Northeast cities whose buyer affordability, renter pressure, housing stock and city-level demand evidence require different underwriting paths.
- New York
- $823k · 6.0% yield
- Boston
- $789k · 5.3% yield

Lake Michigan city alternatives whose direct records differ materially on yield, entry price, renter pressure, housing form and demand risk.
- Chicago
- $336k · 8.6% yield
- Milwaukee
- $231k · 7.6% yield
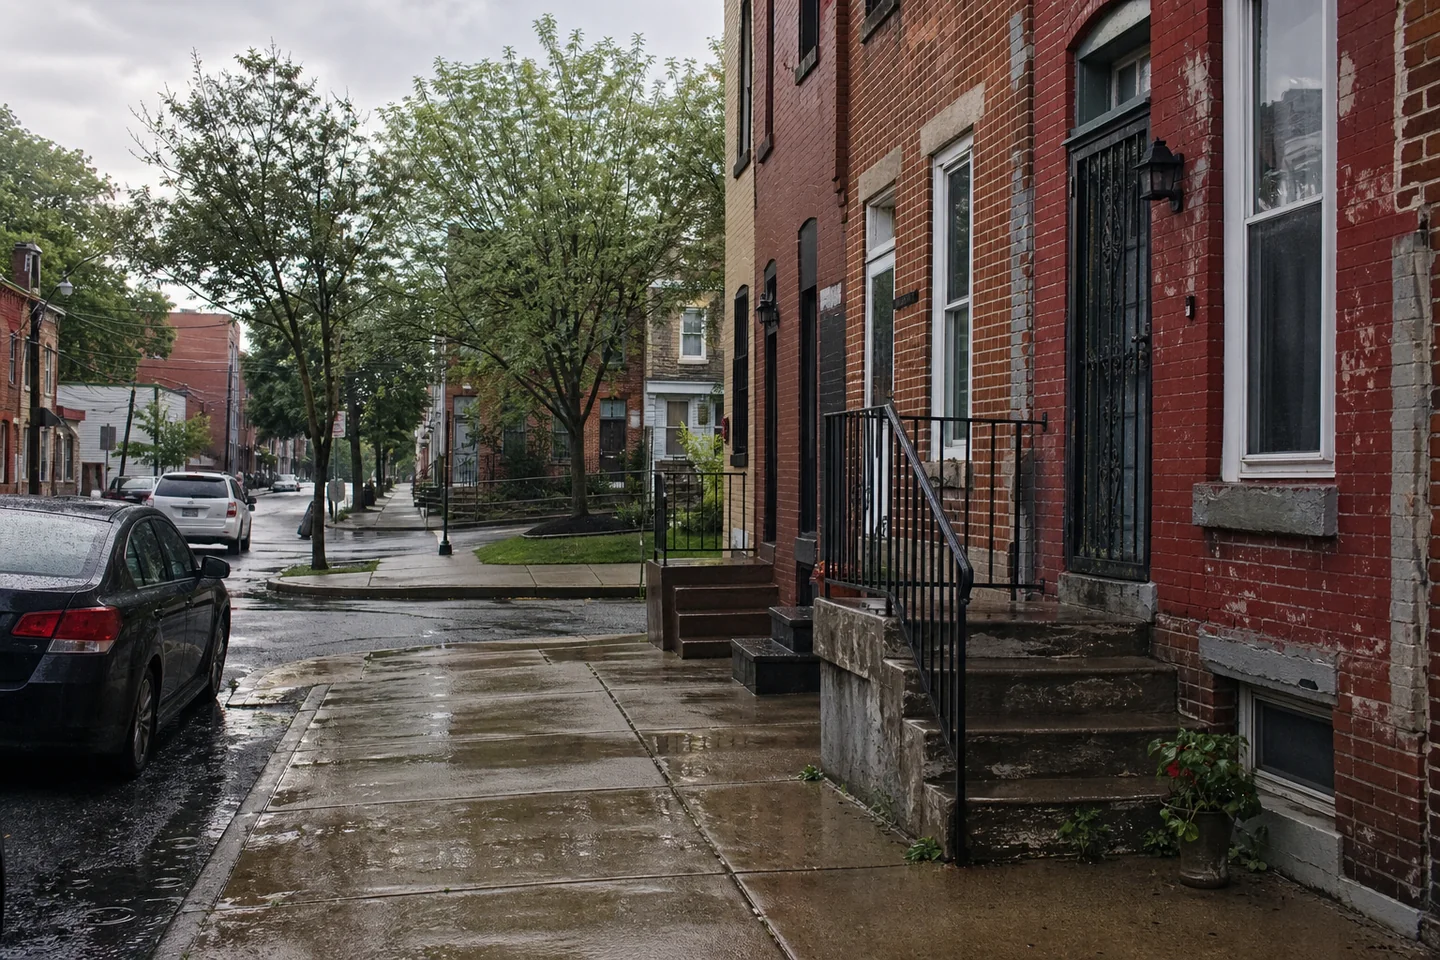
Mid-Atlantic peer cities with material differences in gross yield, acquisition cost, housing stock and recent local demand evidence.
- Philadelphia
- $237k · 9.2% yield
- Baltimore
- $193k · 11.2% yield
Pacific Northwest gateway cities whose entry cost, affordability, renter pressure, housing form and local demand evidence create distinct trade-offs.
- Seattle
- $856k · 3.1% yield
- Portland
- $540k · 3.8% yield
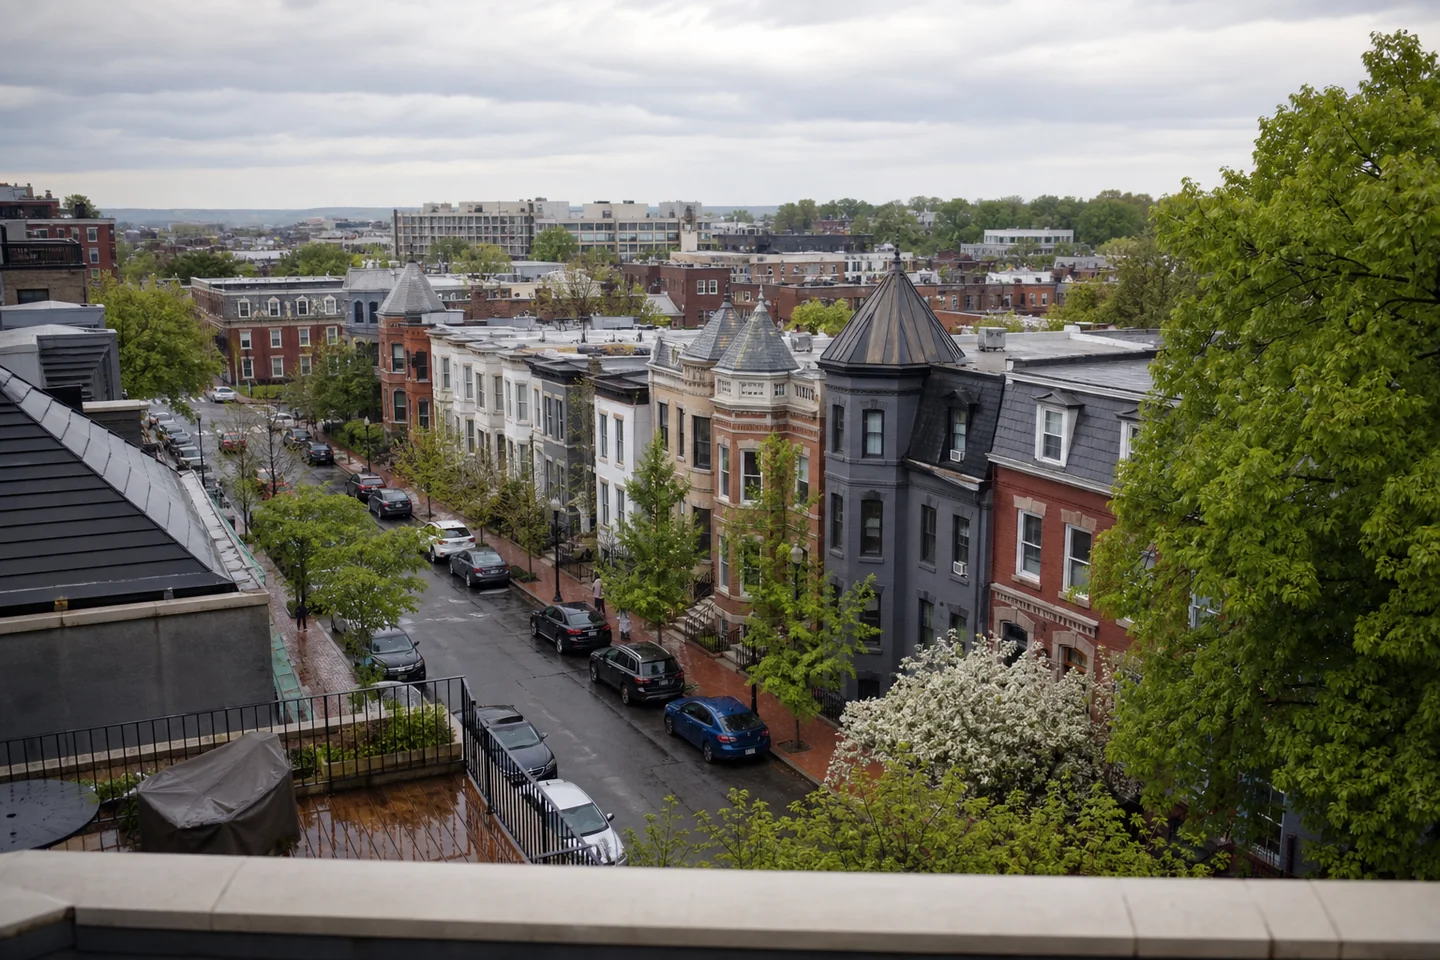
Neighboring Mid-Atlantic cities with material differences across every city comparison lens, including price, yield, pressure and housing form.
- Baltimore
- $193k · 11.2% yield
- Washington
- $579k · 5.2% yield
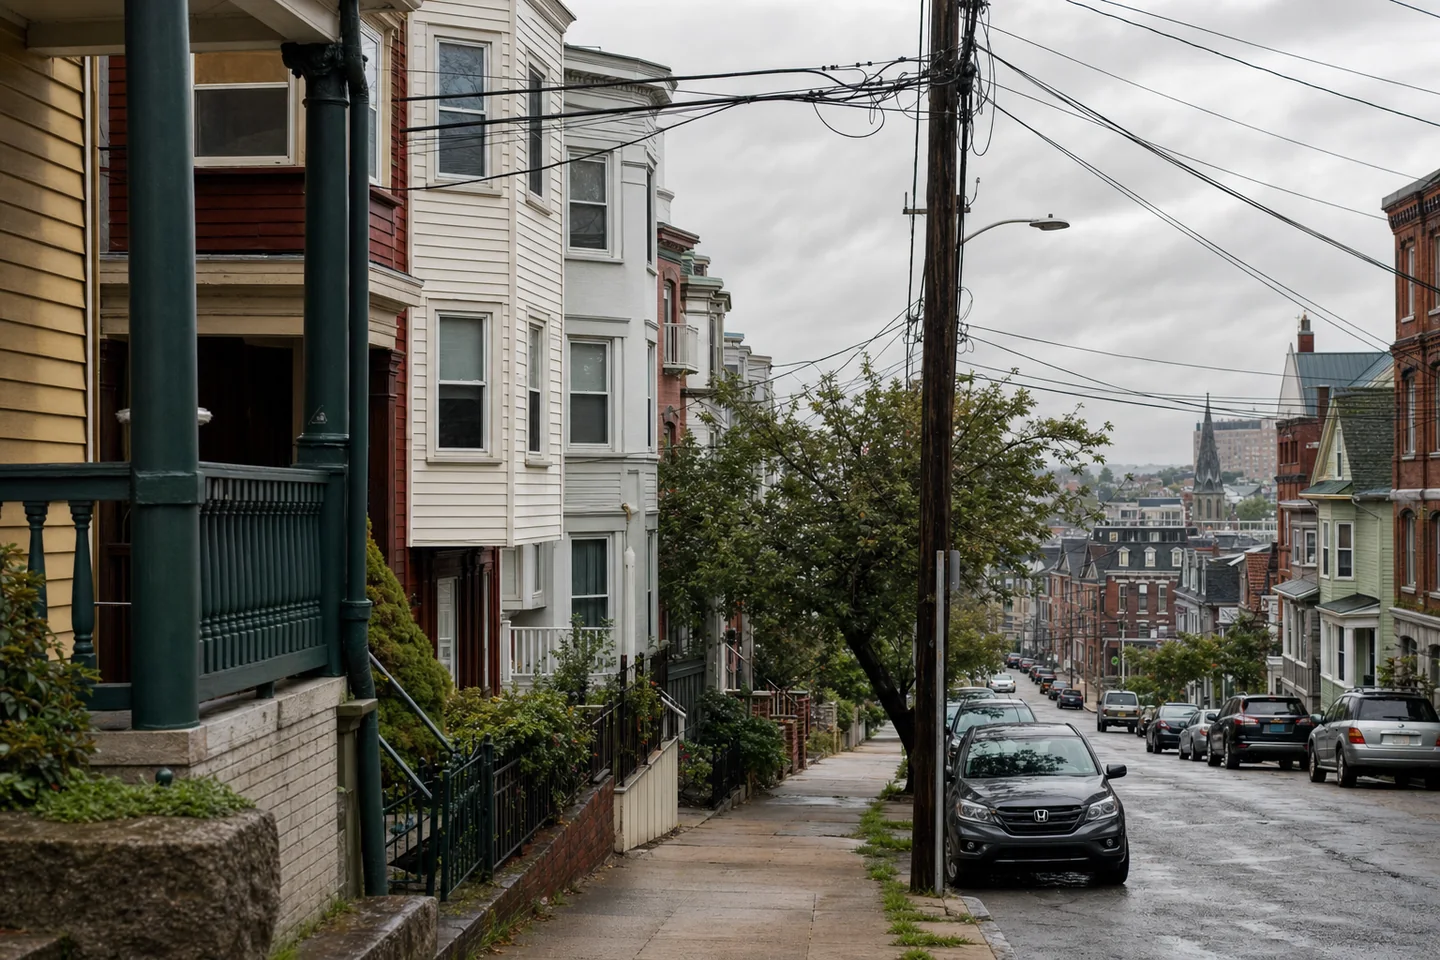
Connected New England cities whose direct yield, entry cost, affordability, housing form and demand-risk records point to different next checks.
- Providence
- $439k · 6.3% yield
- Boston
- $789k · 5.3% yield
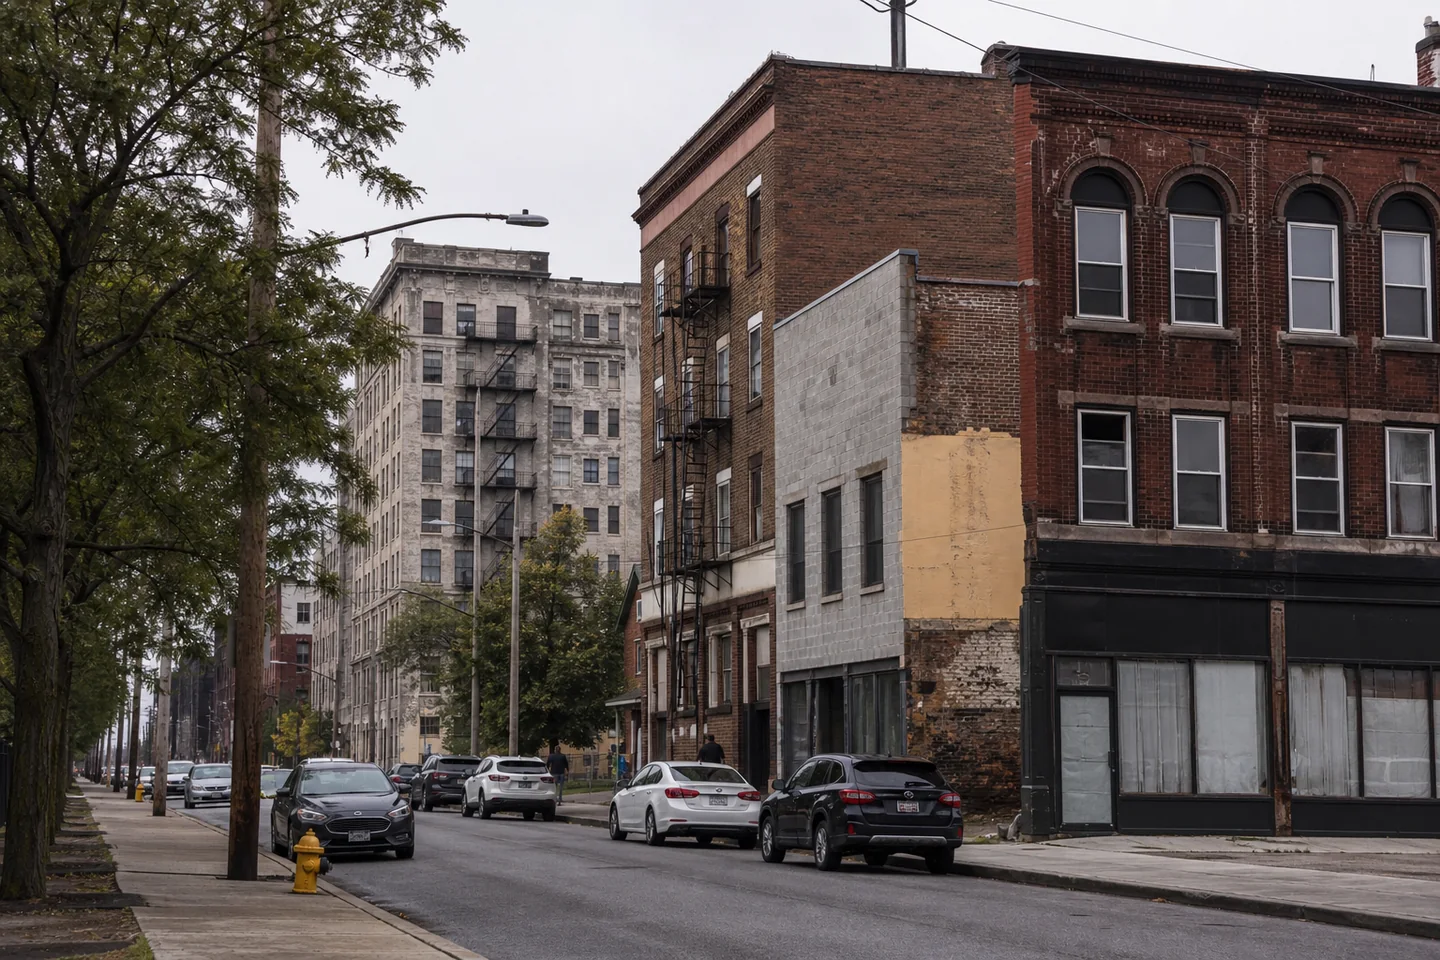
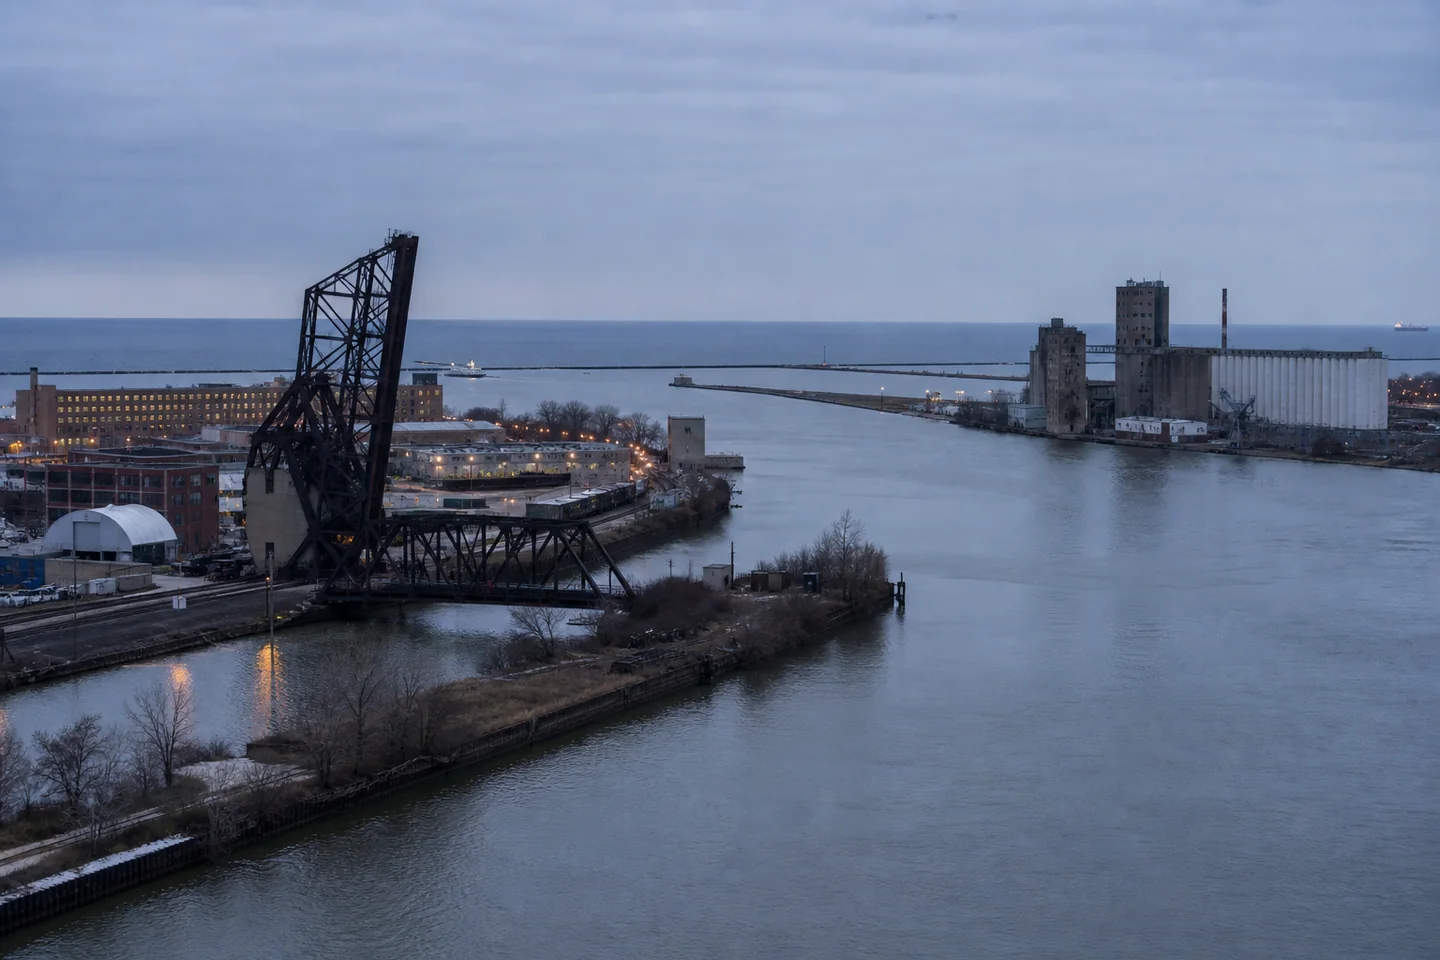
Legacy industrial cities with material differences across all city selection signals and no defensible one-number winner.
- Detroit
- $77k · 21.1% yield
- Cleveland
- $121k · 14.1% yield
Nearby legacy industrial cities with large differences in price, gross yield, affordability, renter pressure and city-level demand risk.
- Cleveland
- $121k · 14.1% yield
- Pittsburgh
- $246k · 7.8% yield


Central US peer cities whose gross-yield, entry-price and housing-stock evidence point to different acquisition and leasing checks.
- Kansas City
- $257k · 6.7% yield
- Omaha
- $301k · 5.8% yield
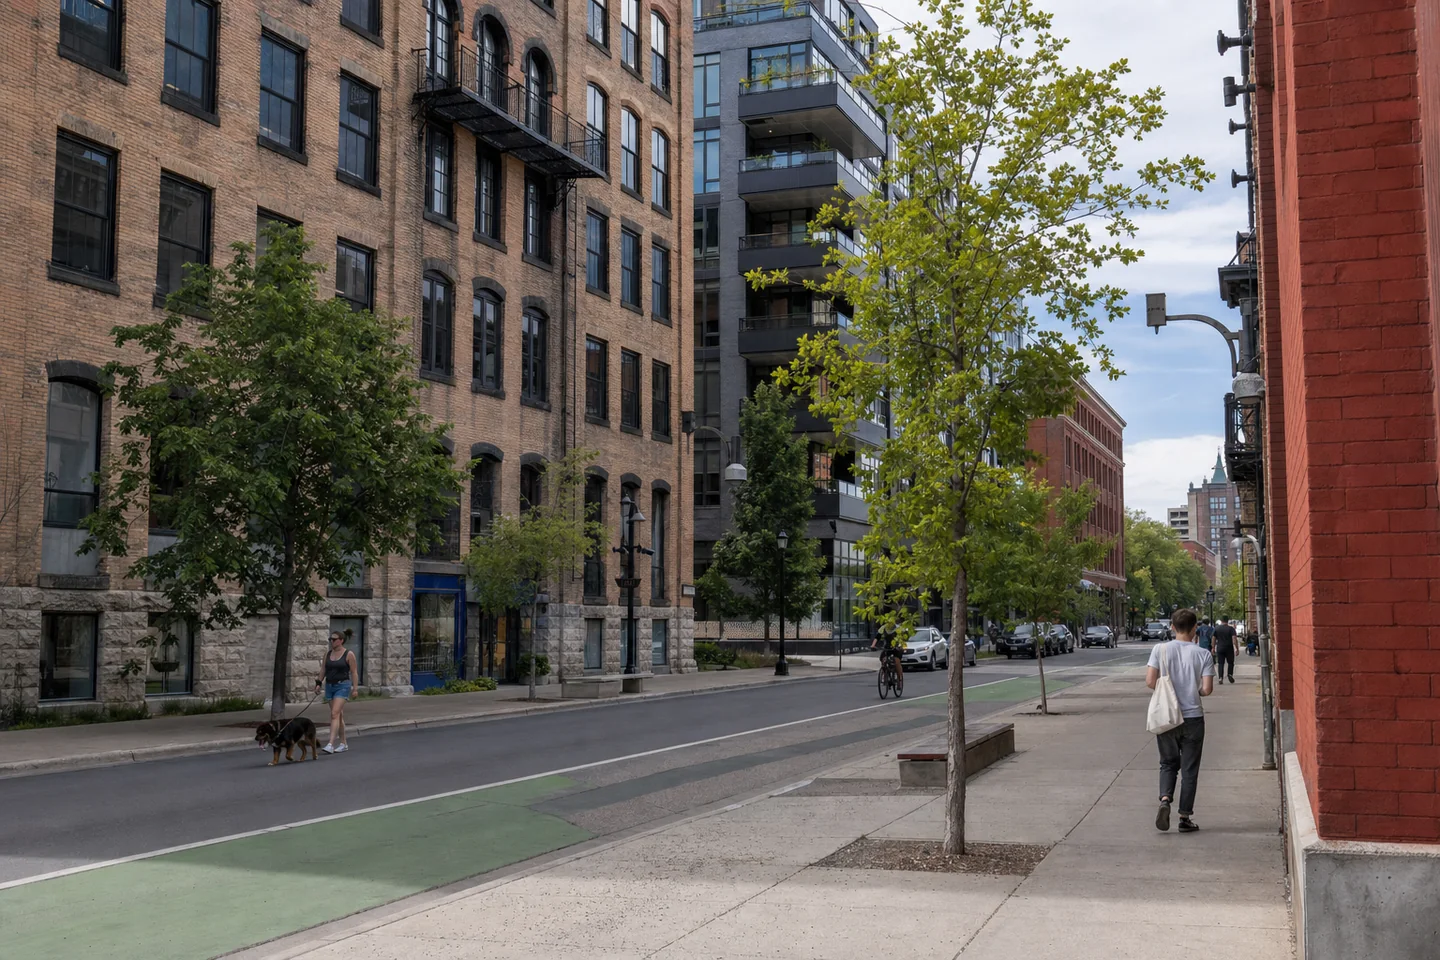
Upper Midwest peers with different gross-yield, acquisition-cost, renter-pressure, housing-stock and local-demand profiles.
- Minneapolis
- $337k · 6.0% yield
- Milwaukee
- $231k · 7.6% yield
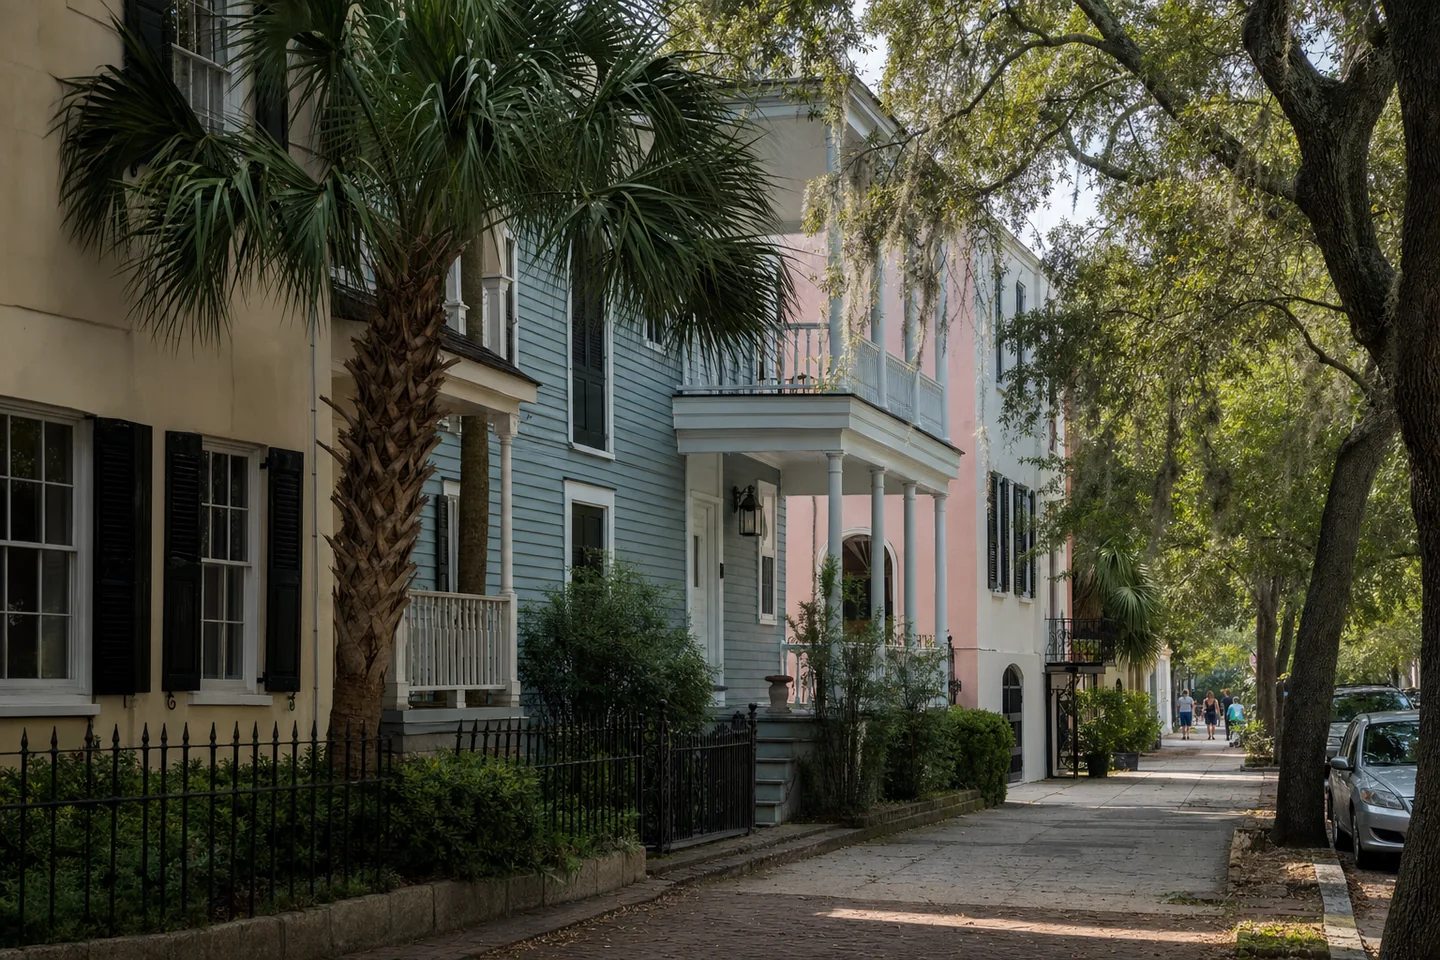

Coastal regional alternatives with material differences across acquisition economics, renter pressure, housing form and local demand risk.
- Charleston
- $598k · 4.5% yield
- Savannah
- $327k · 6.6% yield
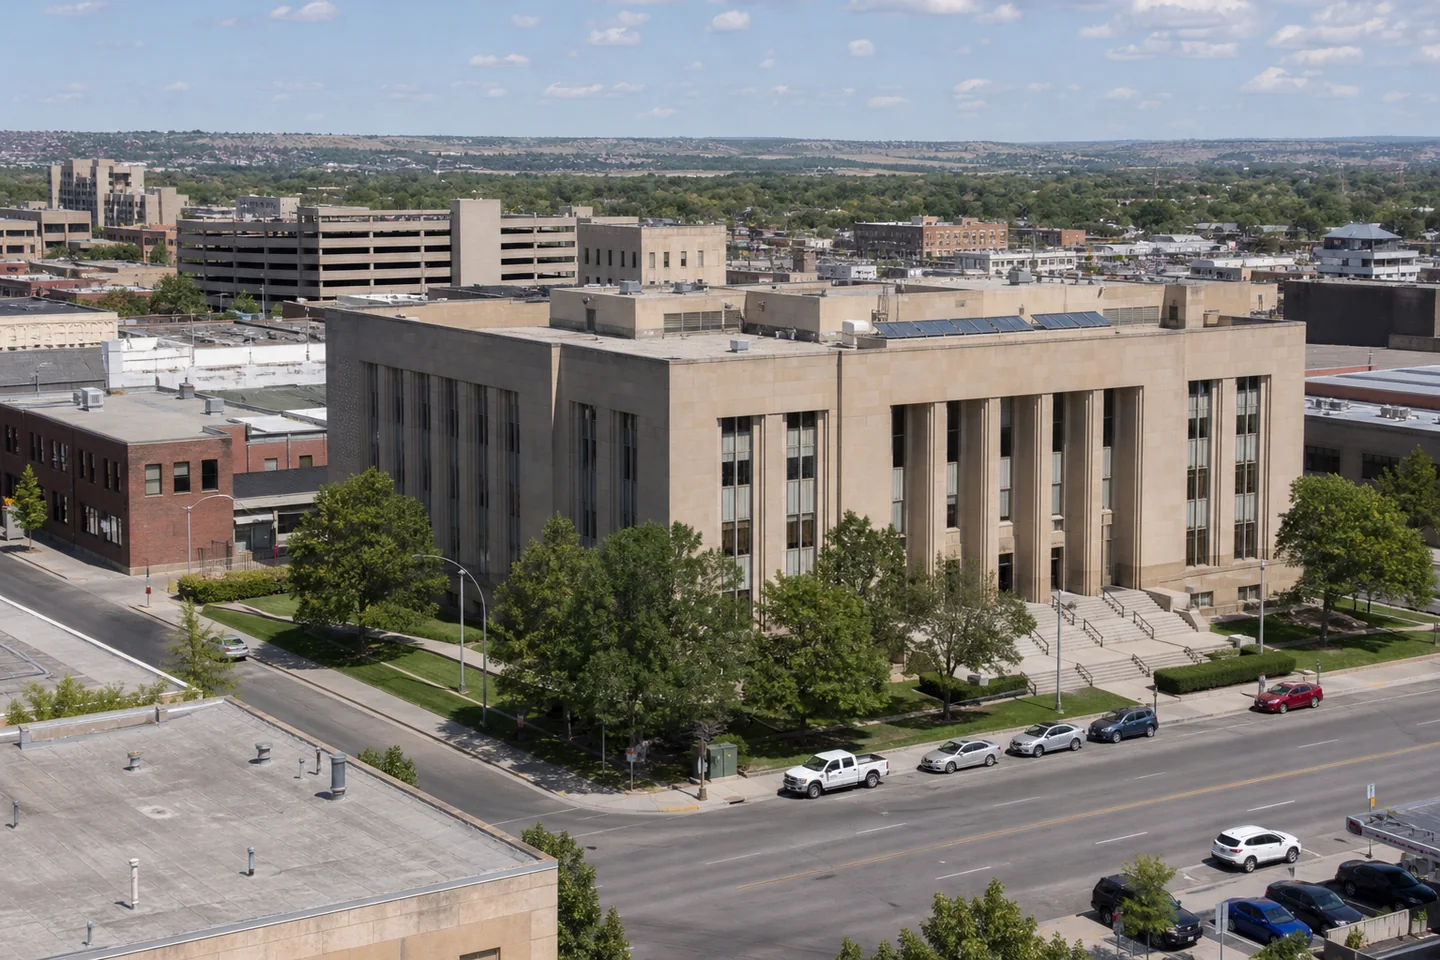
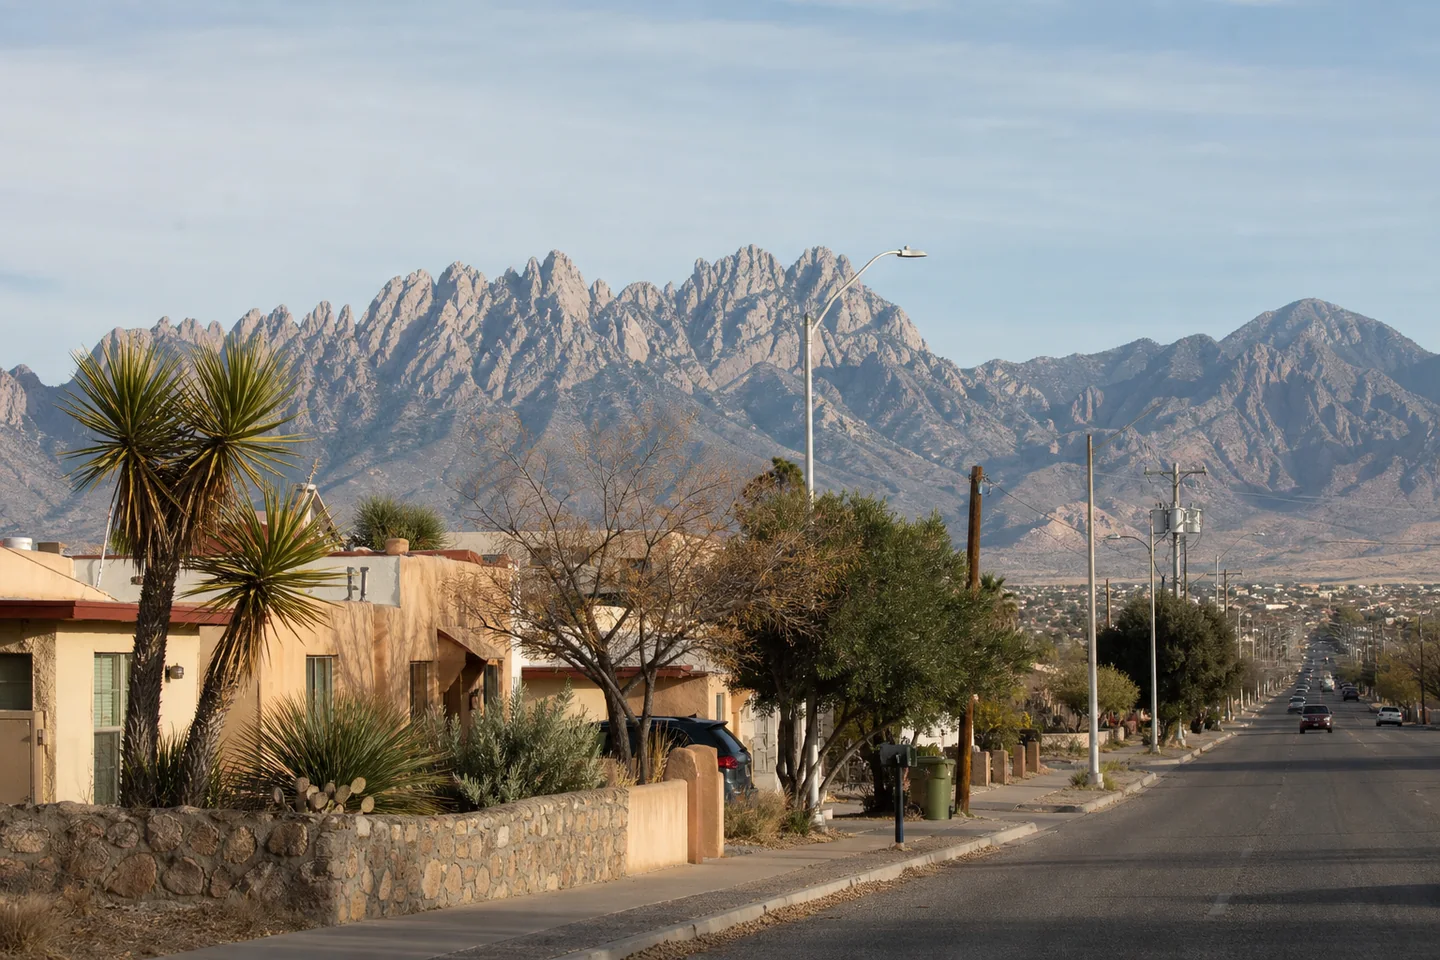
Western regional hubs of similar population scale with material differences in yield, entry price, renter pressure, housing form and demand risk.
- Billings
- $403k · 4.3% yield
- Las Cruces
- $292k · 5.9% yield

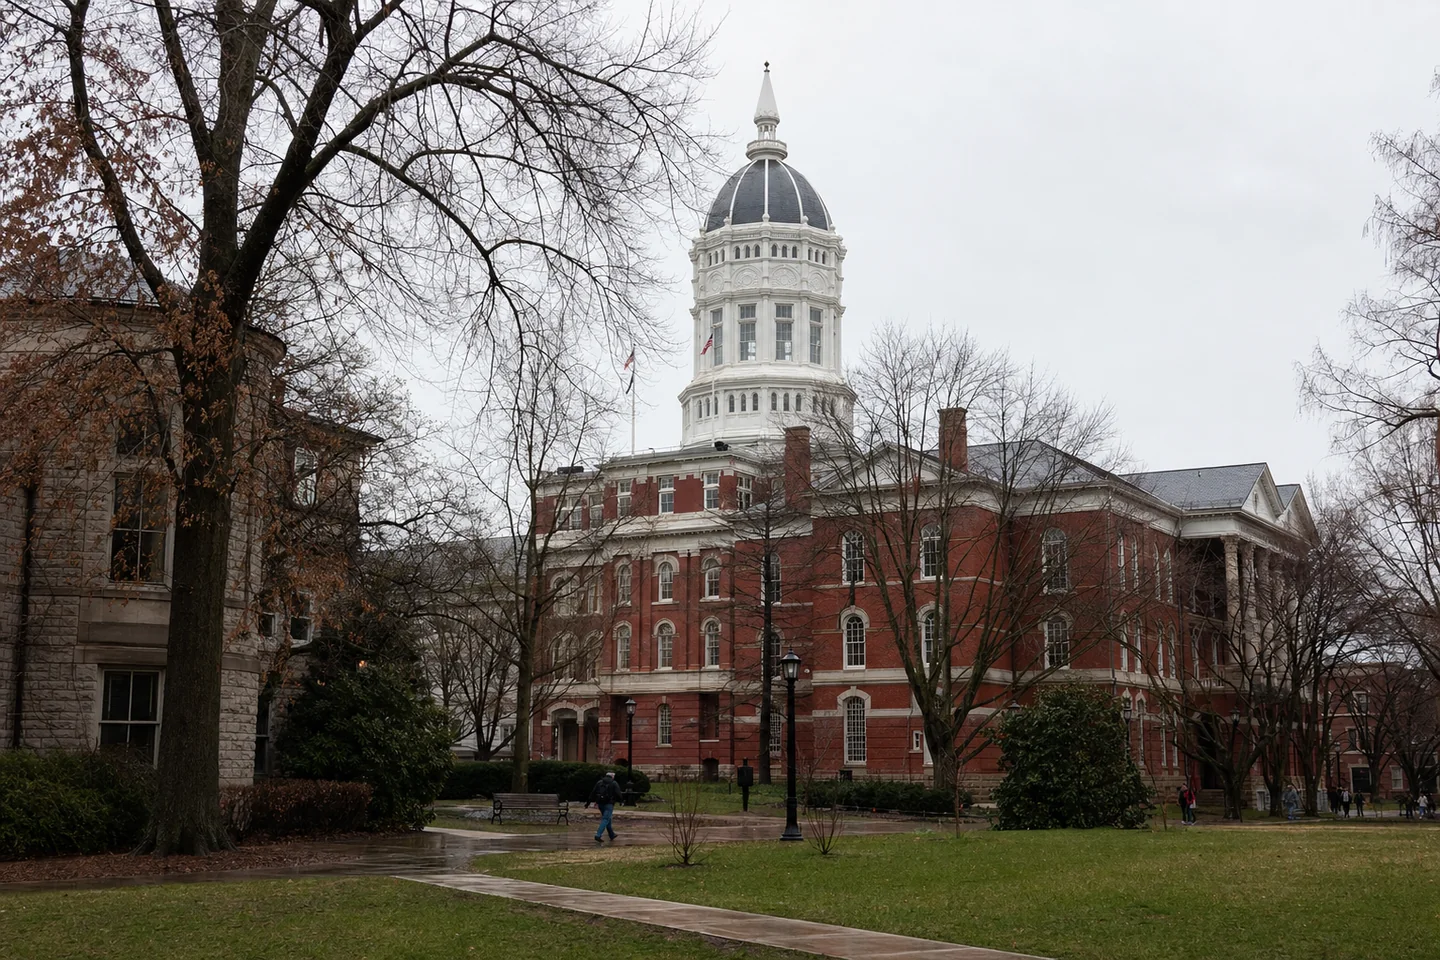
Midwestern regional centers with similar population scale and materially different gross-yield, renter-pressure, housing-stock and local-demand evidence.
- Fargo
- $325k · 4.0% yield
- Columbia
- $330k · 5.2% yield


Fast-growing Interior West alternatives of nearly equal population scale with different renter-pressure, housing-stock and local-demand records.
- Nampa
- $419k · 4.7% yield
- Greeley
- $423k · 4.2% yield


Midwestern regional alternatives with comparable population scale and material differences across every direct-city underwriting lens.
- Davenport
- $197k · 5.8% yield
- Green Bay
- $289k · 4.6% yield


Interior West alternatives with similar population scale but materially different gross-yield, buyer-affordability and housing-stock evidence.
- Missoula
- $576k · 3.2% yield
- Loveland
- $504k · 4.4% yield


Smaller Southern city alternatives with comparable population scale and materially different yield, entry price, renter pressure, housing form and demand risk.
- Kingsport
- $259k · 6.3% yield
- Valdosta
- $215k · 7.5% yield
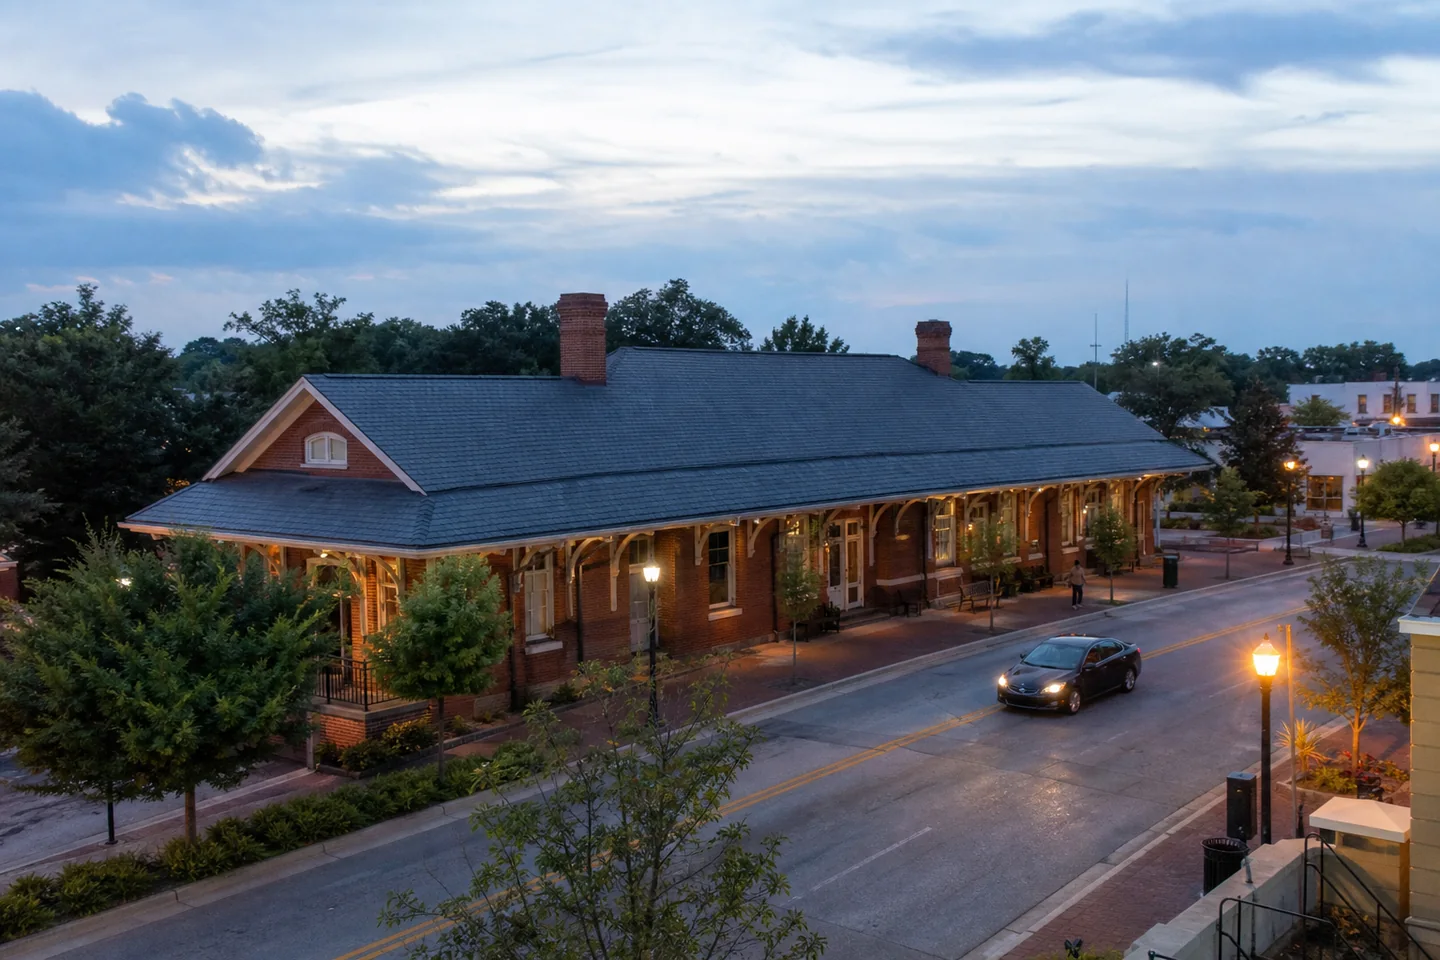
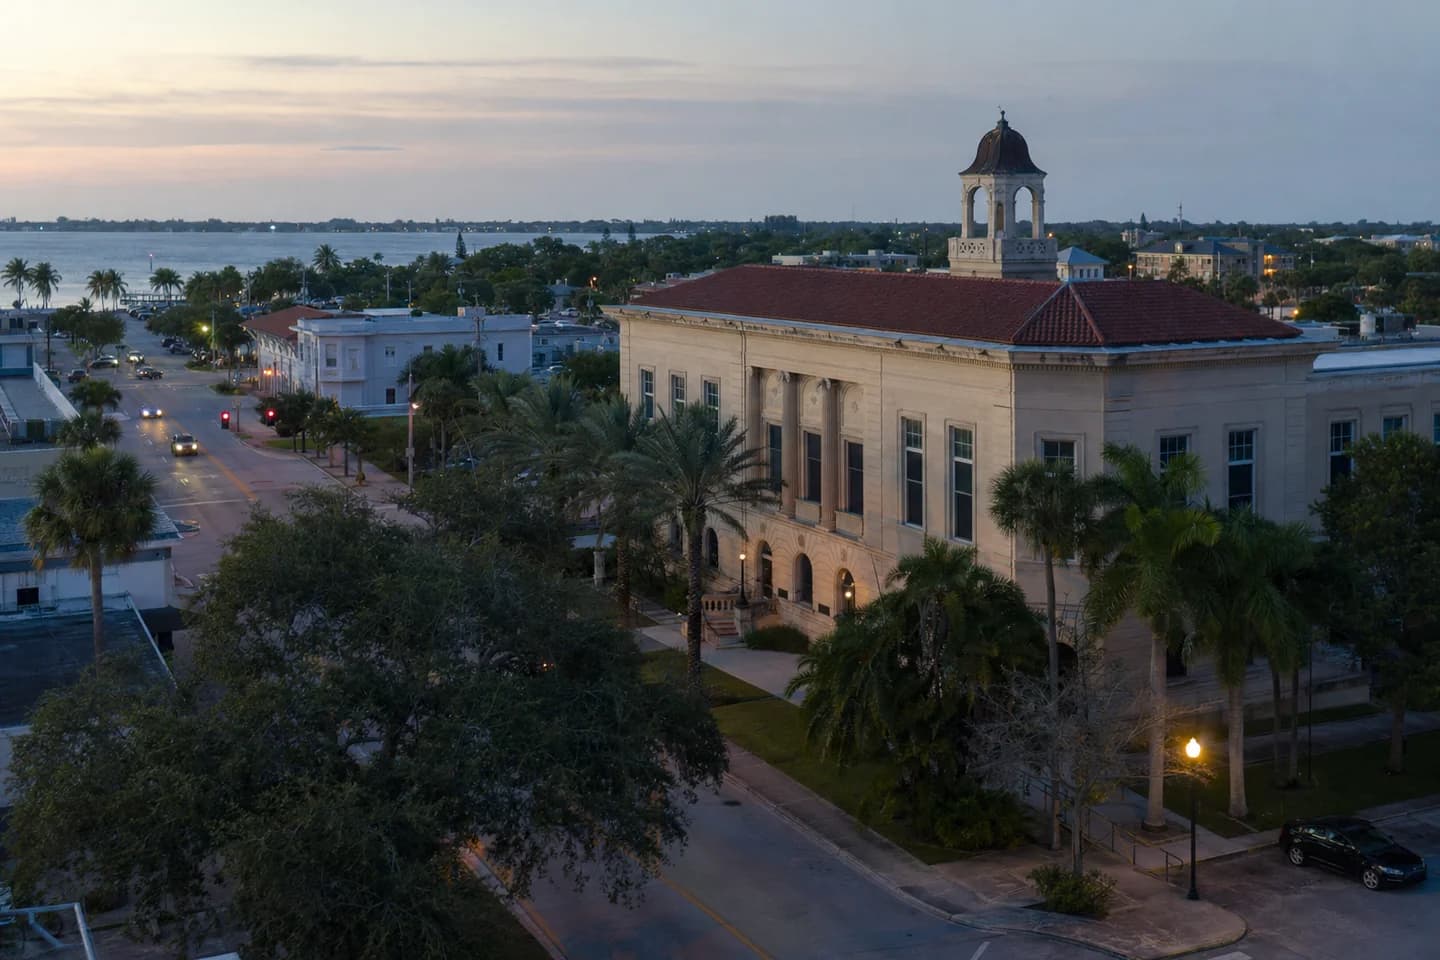
Smaller Southern growth-market alternatives with comparable scale but different price, rent, affordability, tenure, housing-stock and demand evidence.
- Greer
- $355k · 5.8% yield
- Fort Pierce
- $278k · 8.4% yield
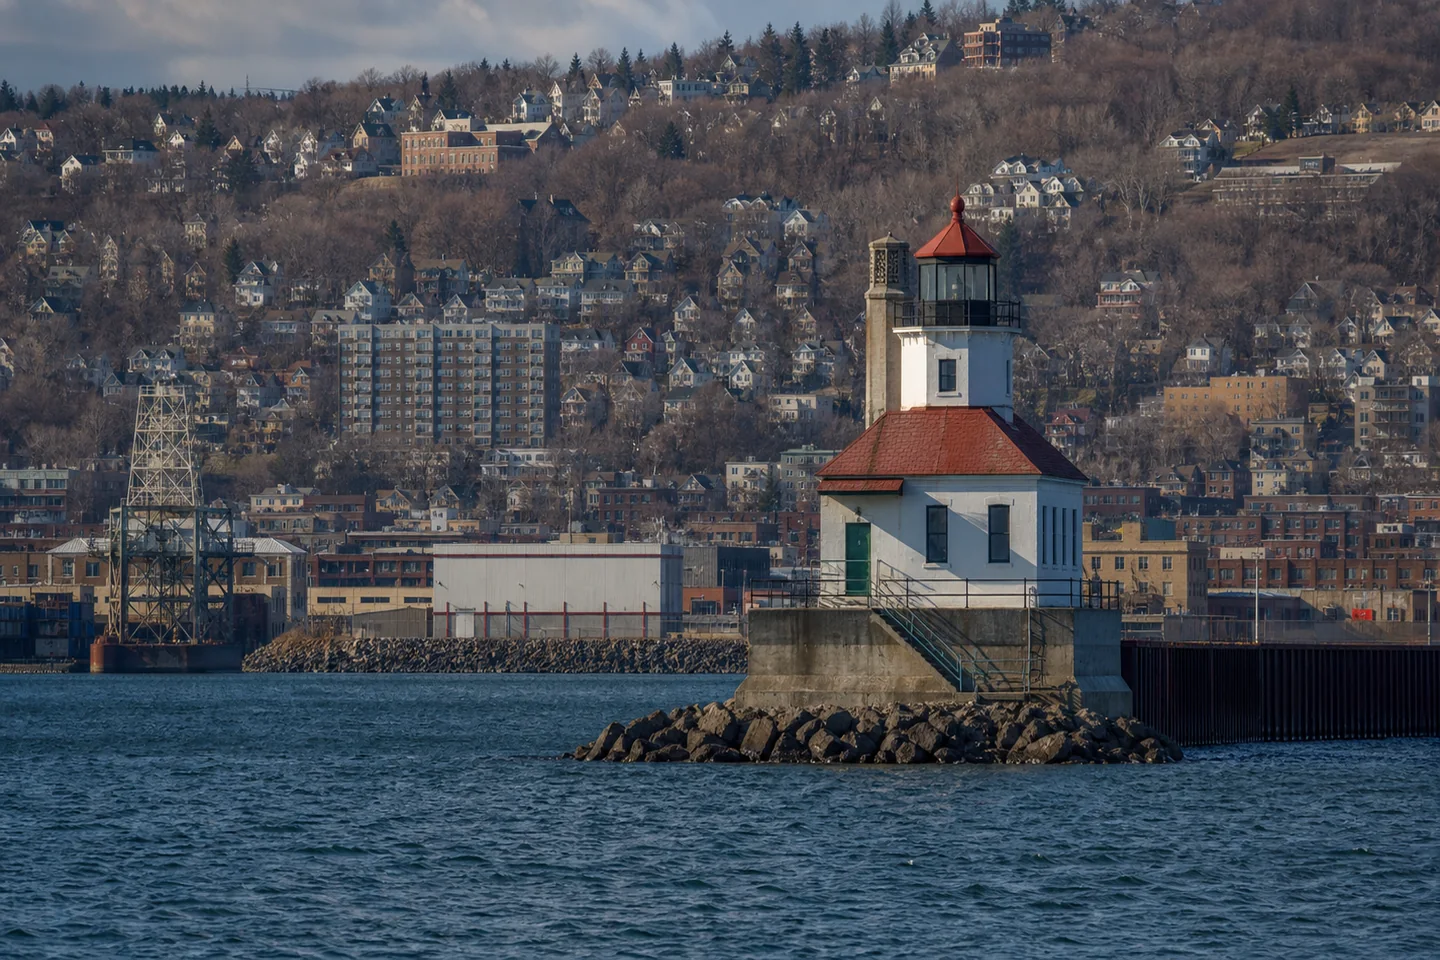
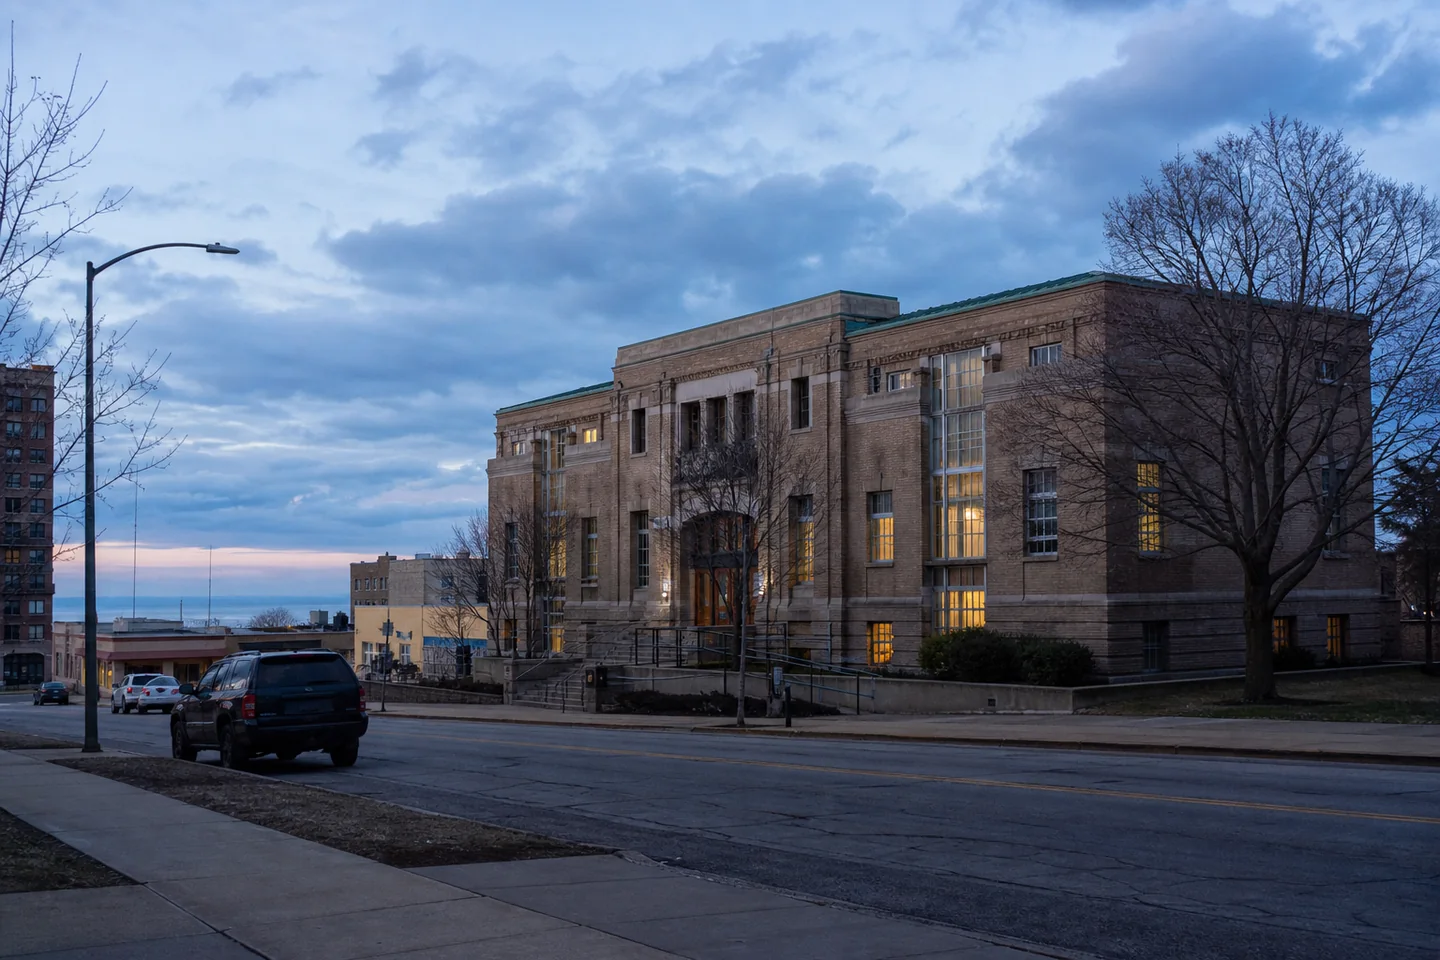
Great Lakes regional alternatives with comparable population scale and materially different yield, entry price, affordability and housing-stock evidence.
- Duluth
- $304k · 5.8% yield
- Waukegan
- $248k · 8.0% yield
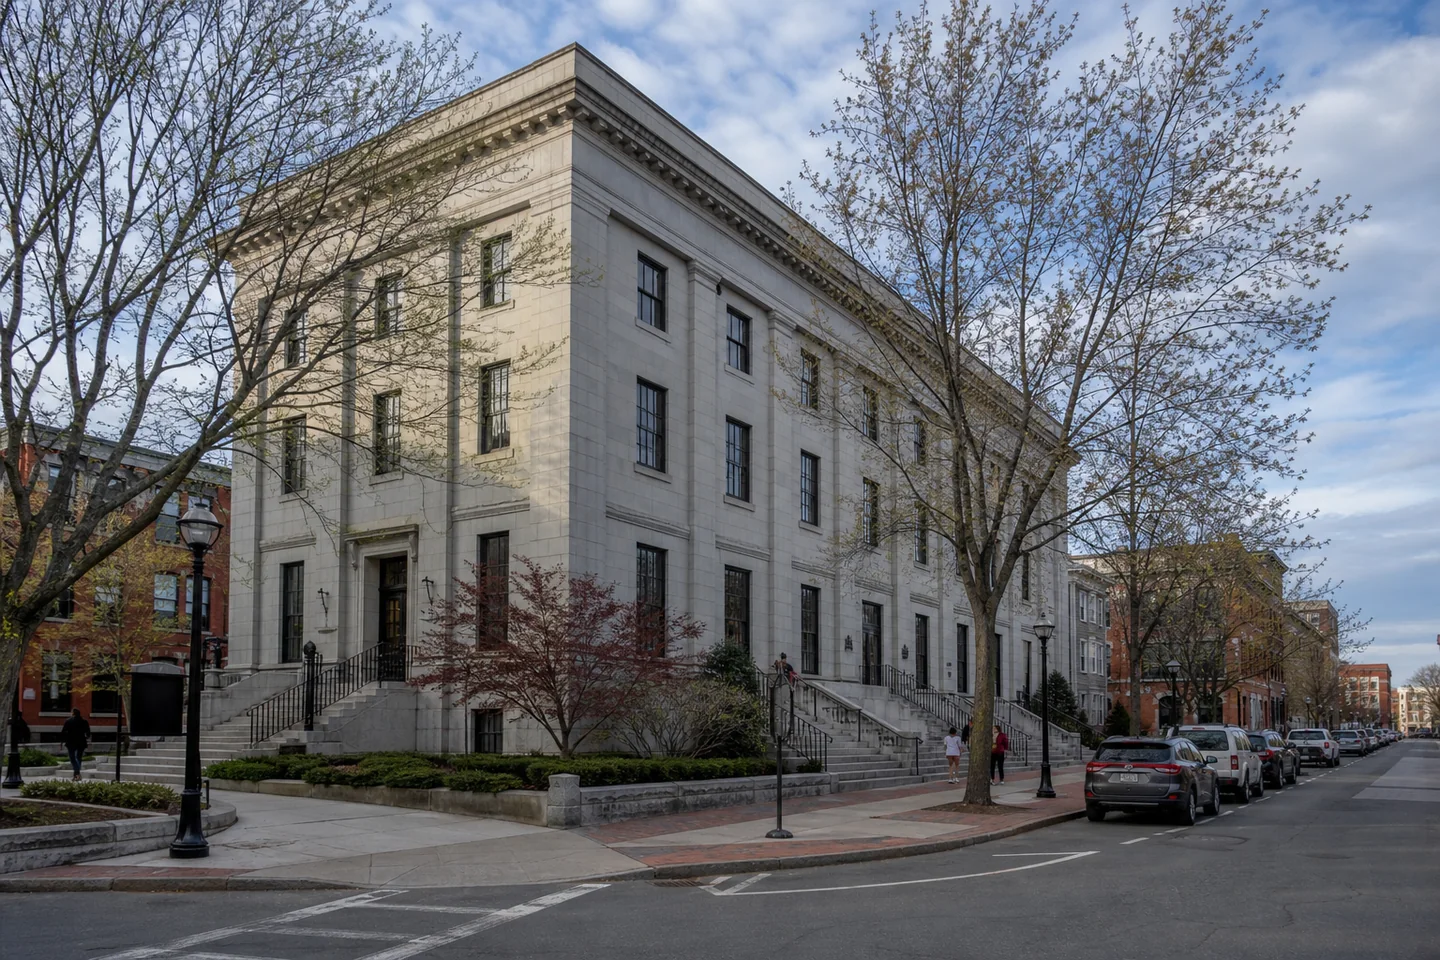
Nearby New England city alternatives with similar population scale and materially different affordability, renter pressure, housing stock and local-demand evidence.
- Nashua
- $517k · 5.1% yield
- Lawrence
- $522k · 5.4% yield
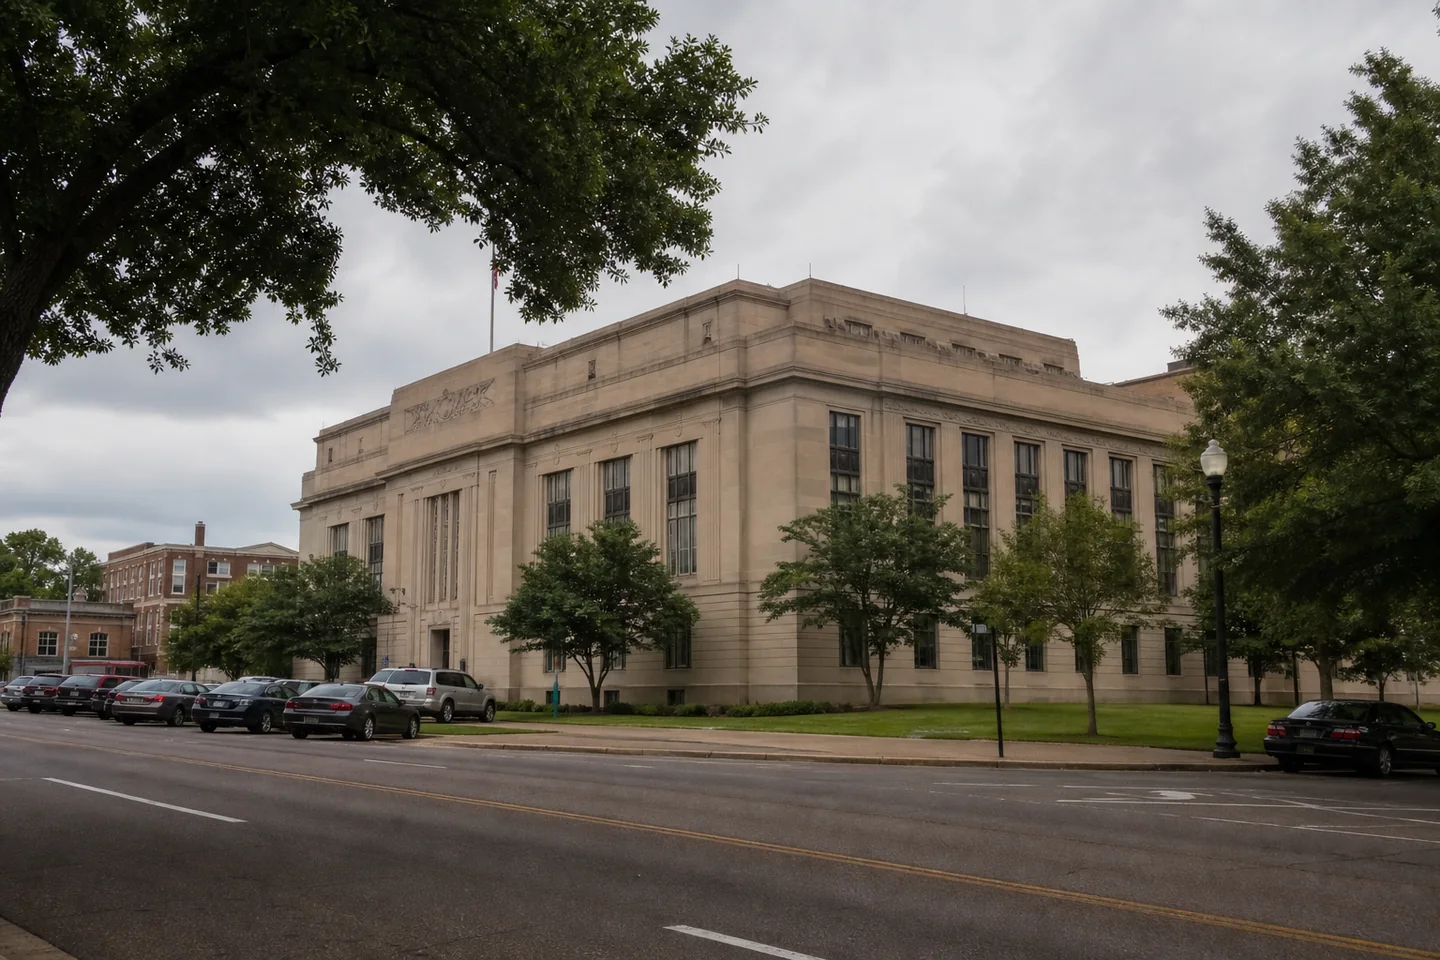

Smaller Southern regional centers with similar population scale and material differences across all six direct-city investment screens.
- Hattiesburg
- $225k · 7.6% yield
- Charleston
- $172k · 9.5% yield

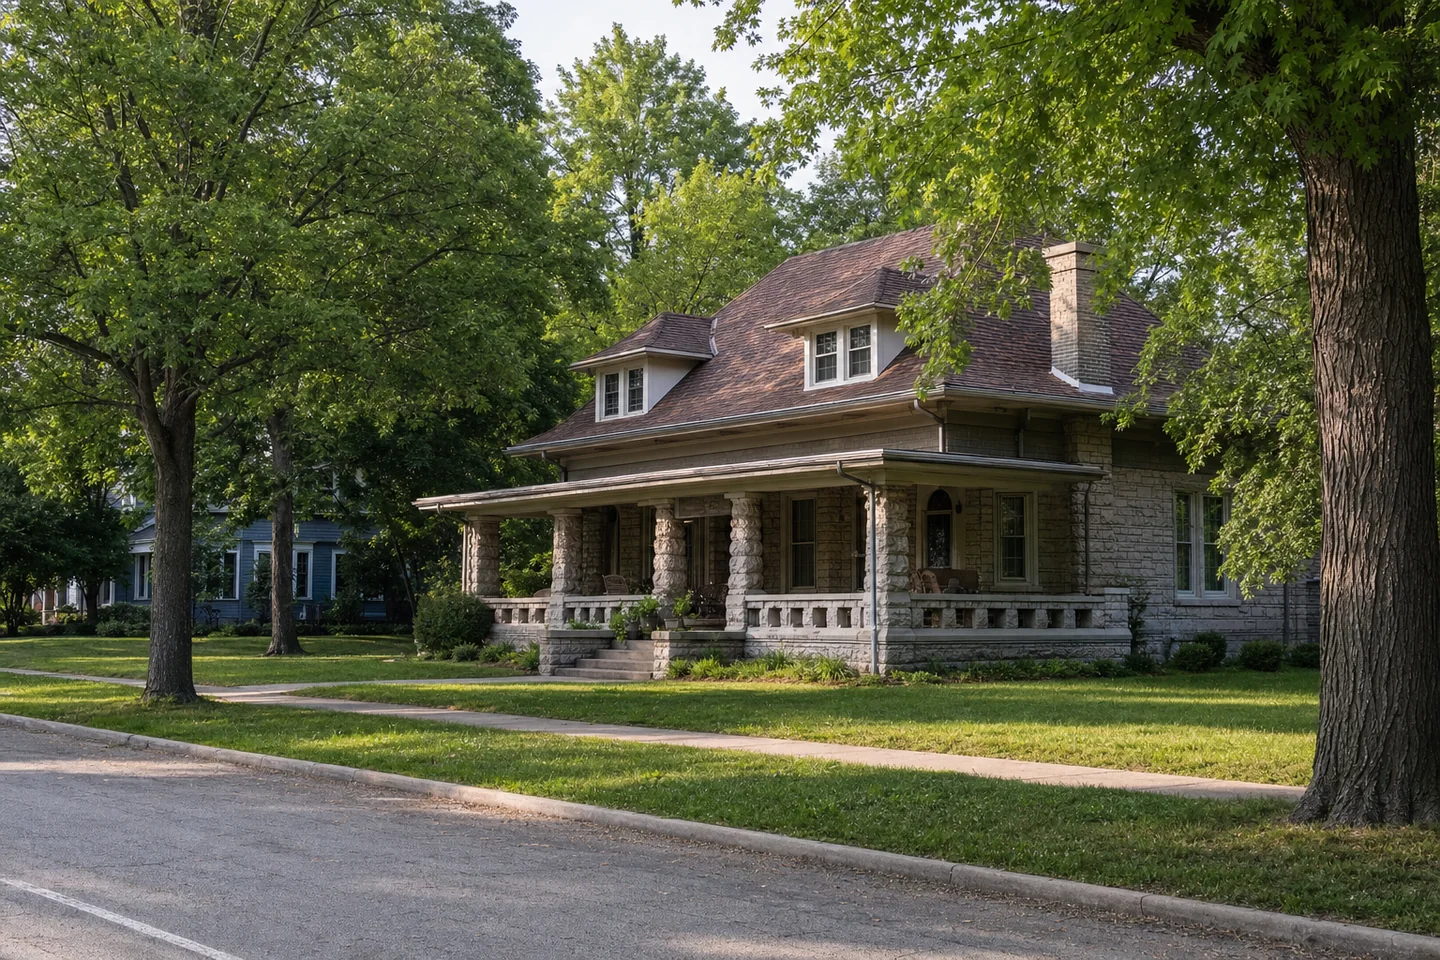
Midwestern university-market alternatives of similar scale whose yield, affordability, renter pressure, housing stock and demand evidence diverge materially.
- Iowa City
- $306k · 5.1% yield
- Bloomington
- $271k · 6.0% yield

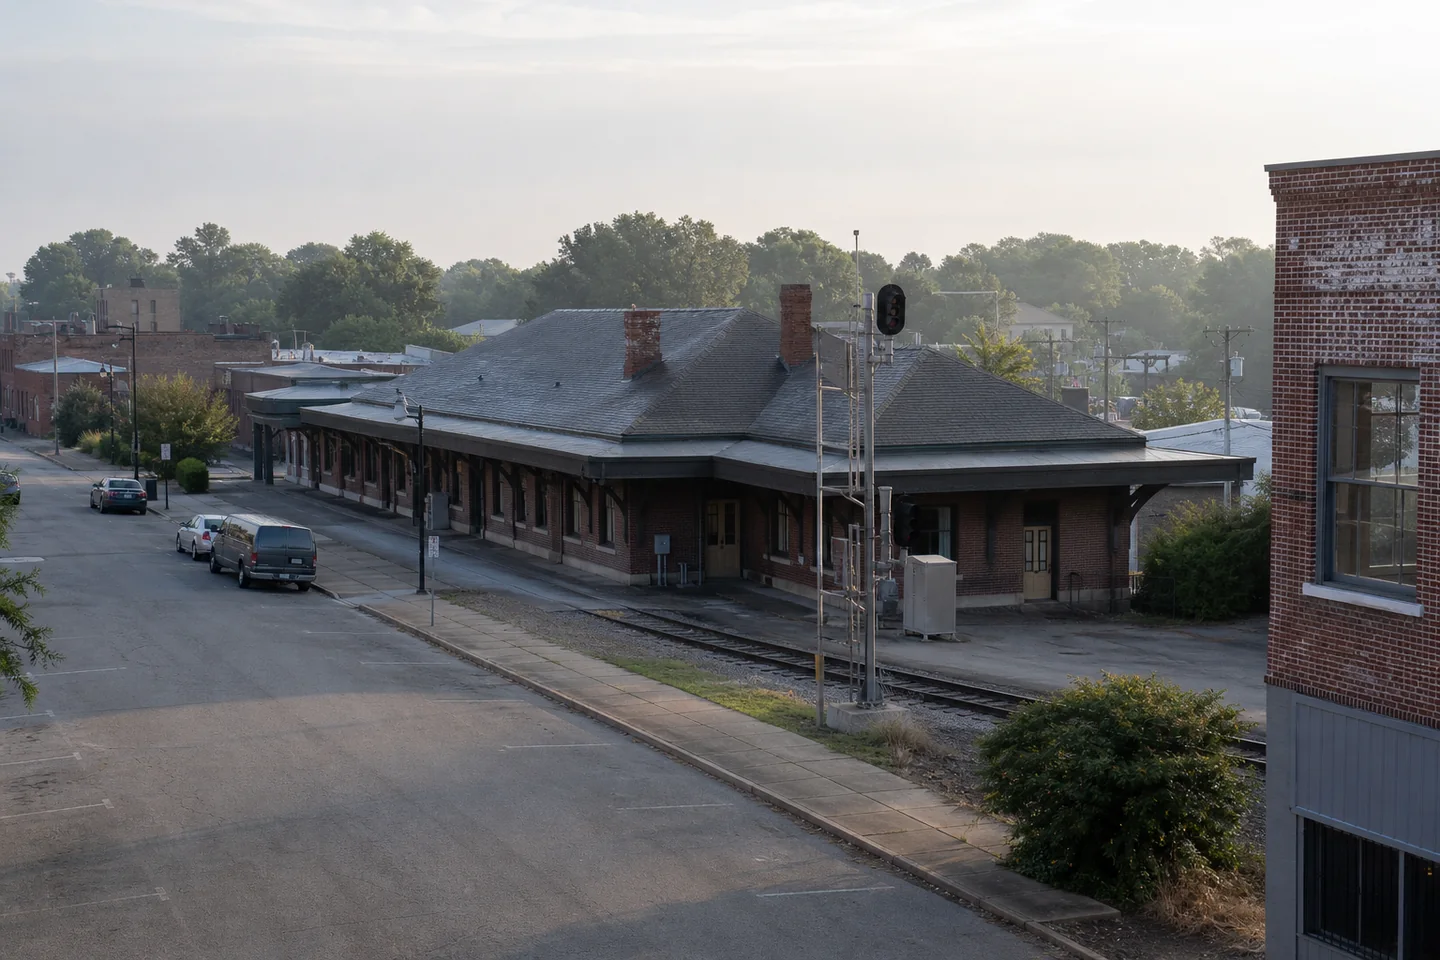
Carolinas regional centers of comparable population scale with material differences across entry price, yield, tenant budgets, housing form and demand risk.
- Sumter
- $217k · 8.5% yield
- Salisbury
- $286k · 5.1% yield
Western regional centers with nearly equal population scale and materially different cost, yield, renter-pressure, housing-stock and demand screens.
- Olympia
- $539k · 4.5% yield
- Bozeman
- $734k · 3.6% yield

Midwestern employment and education centers of similar scale whose direct city records produce different affordability, yield, renter-pressure and housing-stock decisions.
- Midland
- $260k · 6.8% yield
- West Lafayette
- $375k · 5.9% yield

South-Central employment and education markets with similar population reach and materially different acquisition cost, yield, renter pressure, housing form and demand evidence.
- Bentonville
- $497k · 4.0% yield
- Stillwater
- $272k · 6.3% yield
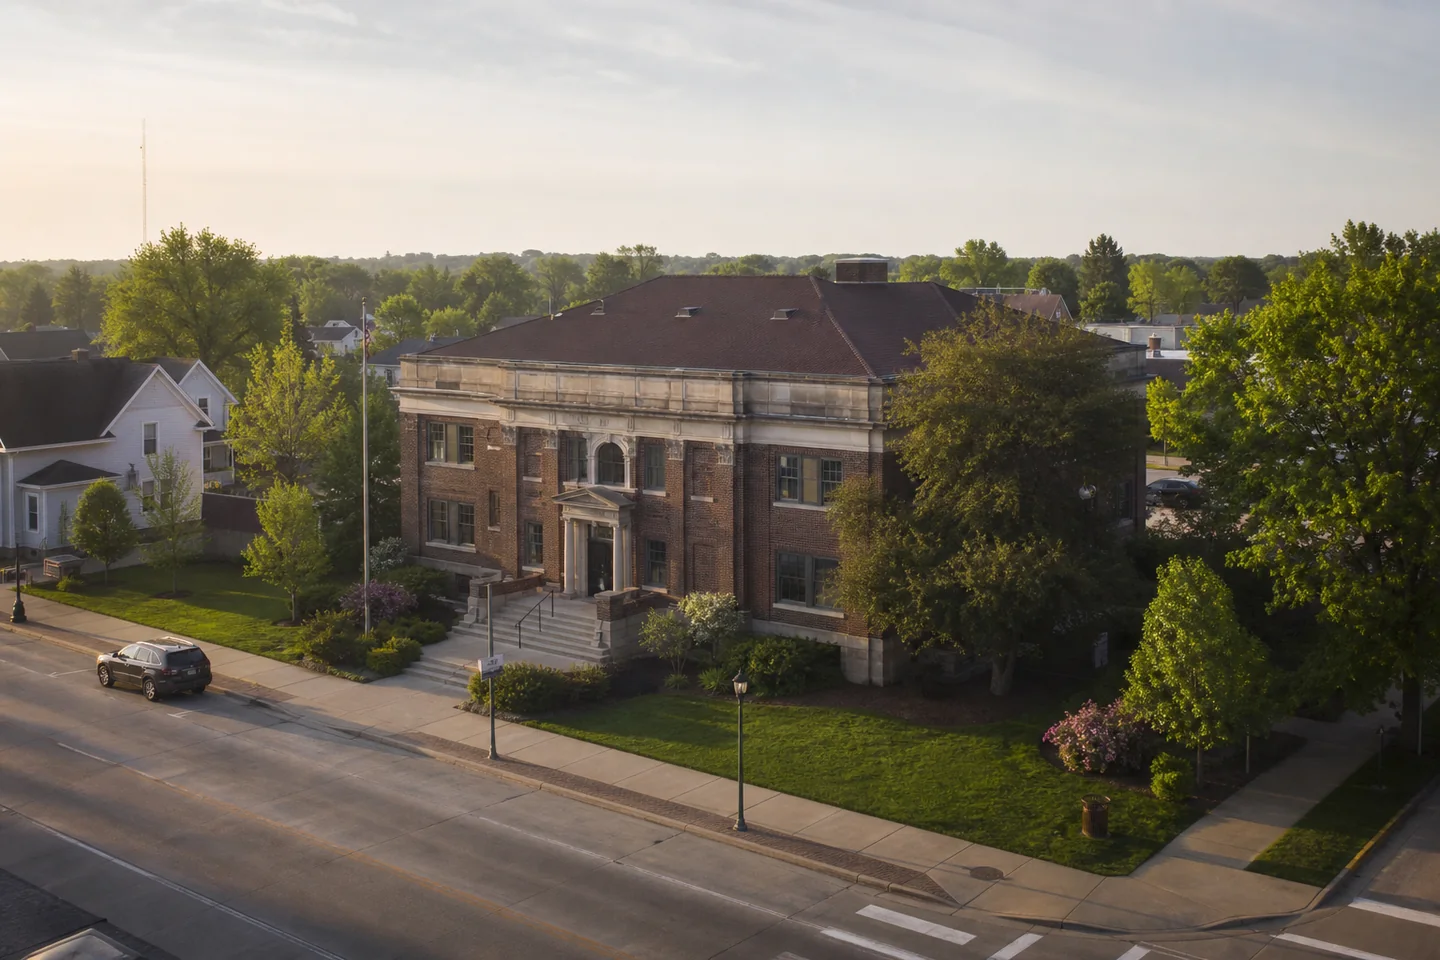
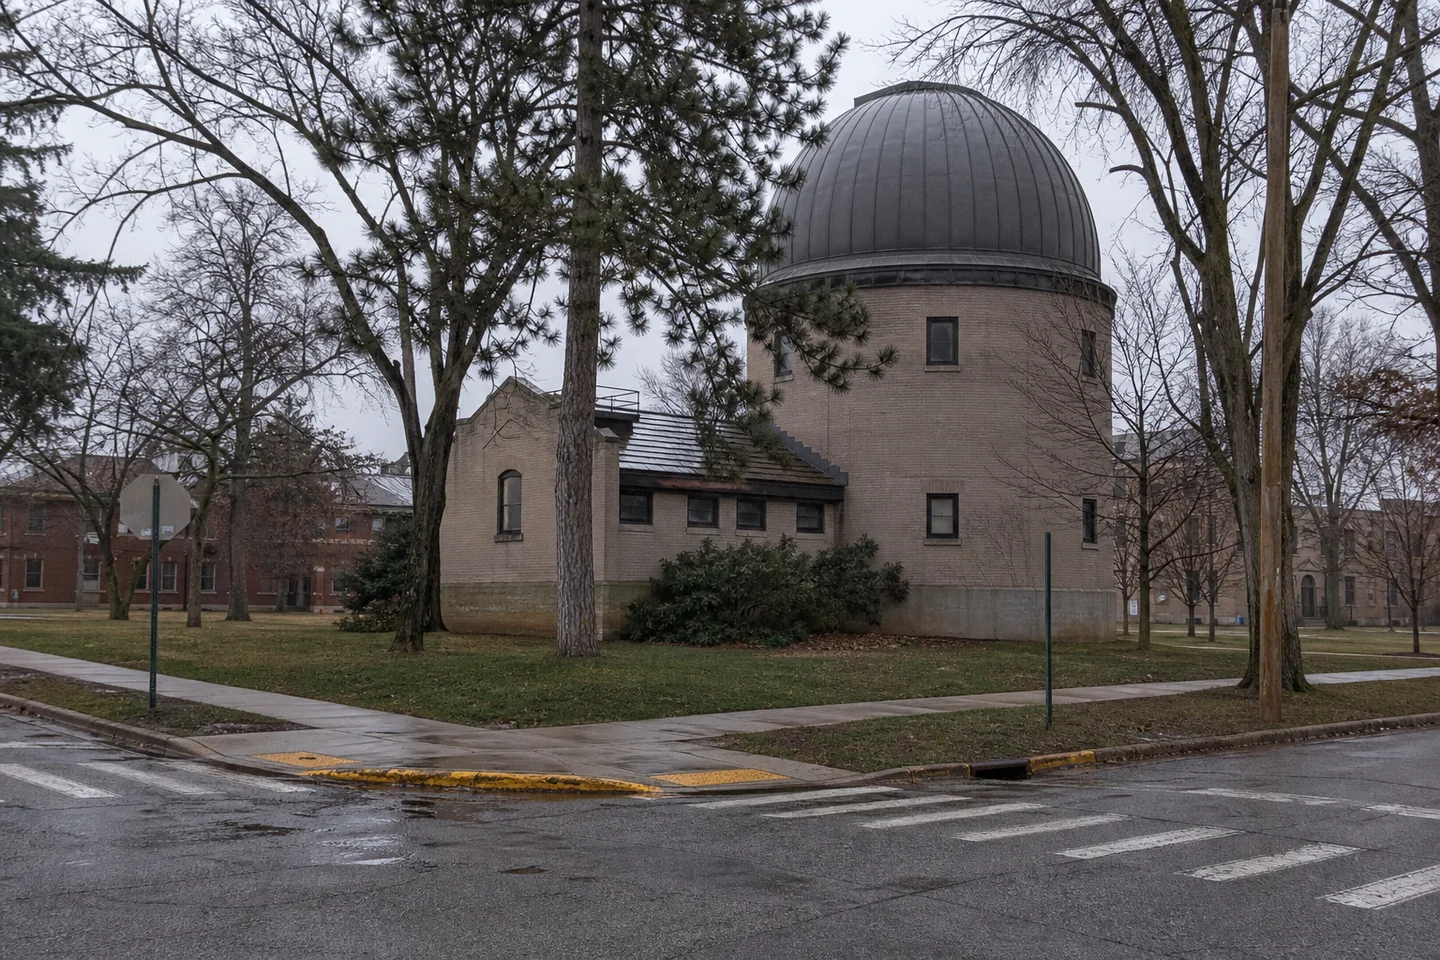
Midwestern cities of nearly equal population scale whose direct evidence separates yield, affordability, renter pressure, housing stock and local-demand risk.
- Marion
- $282k · 5.4% yield
- Urbana
- $210k · 7.1% yield
Test cities with a comparable role but a different housing profile.
These deliberately selected peers reveal a useful contrast that geography alone would not surface.
Two nationally prominent rental cities with sharply different entry price, gross yield, affordability, renter pressure and housing-stock evidence.
- New York
- $823k · 6.0% yield
- Chicago
- $336k · 8.6% yield
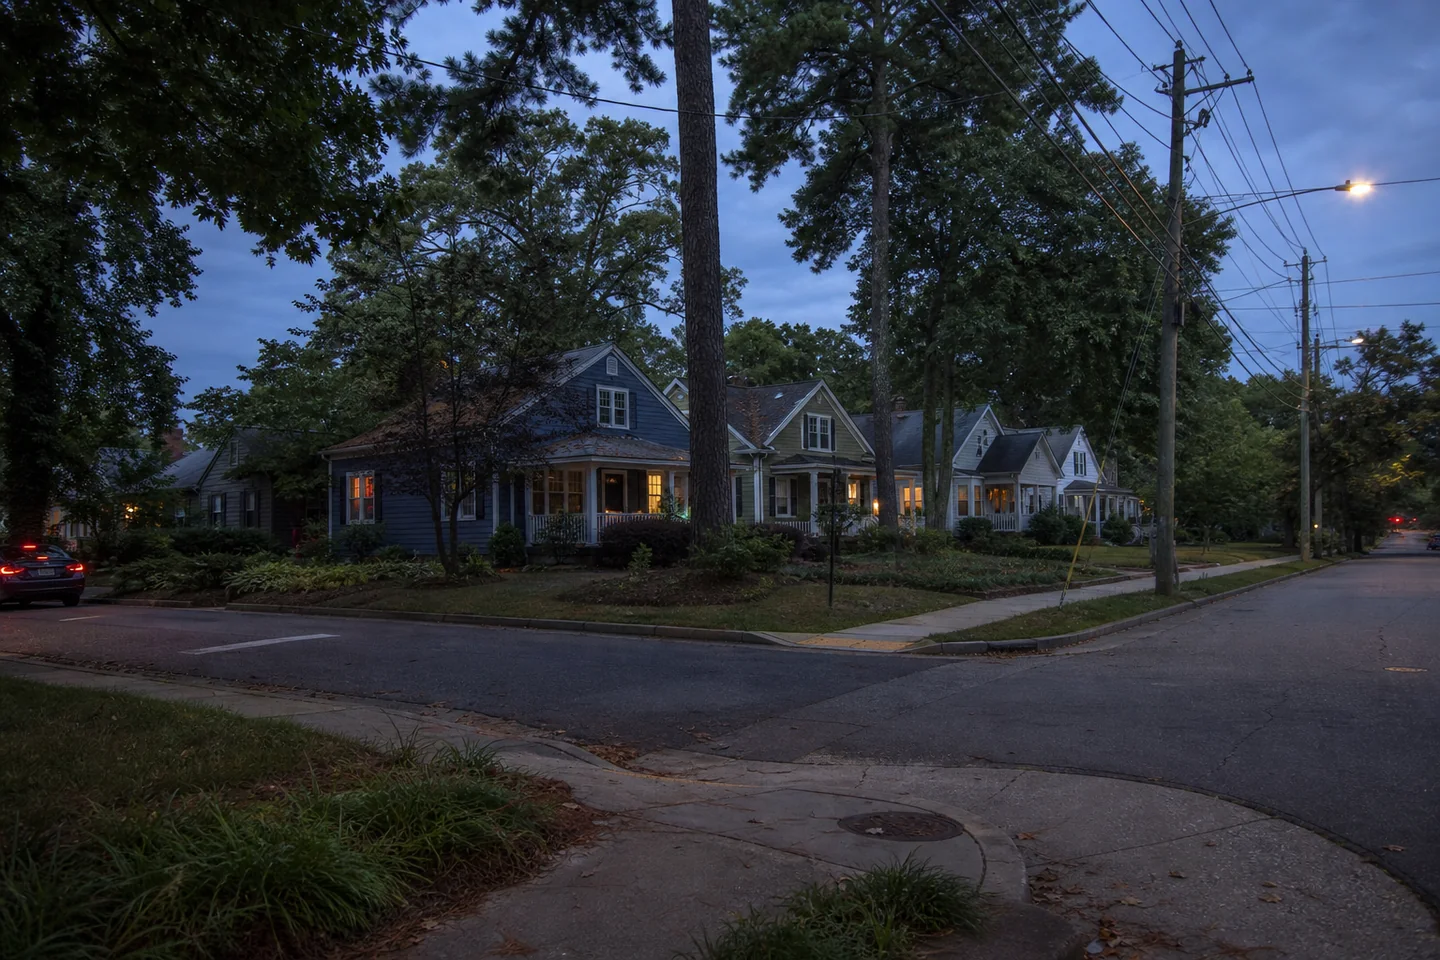

Southeastern employment hubs whose direct gross-yield, renter-pressure, housing-stock and local-demand records imply different underwriting priorities.
- Raleigh
- $436k · 4.3% yield
- Atlanta
- $387k · 5.9% yield

Cross-region employment centers of similar population scale with materially different yield, entry price, affordability and housing-stock evidence.
- Billings
- $403k · 4.3% yield
- Rochester
- $348k · 5.9% yield

Cross-region growth-city peers of nearly equal population scale with material differences in yield, affordability, housing stock and local-demand evidence.
- Nampa
- $419k · 4.7% yield
- Concord
- $387k · 5.6% yield

Cross-region city peers of nearly equal population scale with material differences in yield, entry price, affordability, renter pressure and housing stock.
- Fargo
- $325k · 4.0% yield
- Norman
- $266k · 6.2% yield

Cross-region cities of nearly equal population scale whose yield, affordability, renter pressure, housing stock and local-demand records produce different underwriting paths.
- Toms River
- $471k · 7.1% yield
- Asheville
- $464k · 4.4% yield

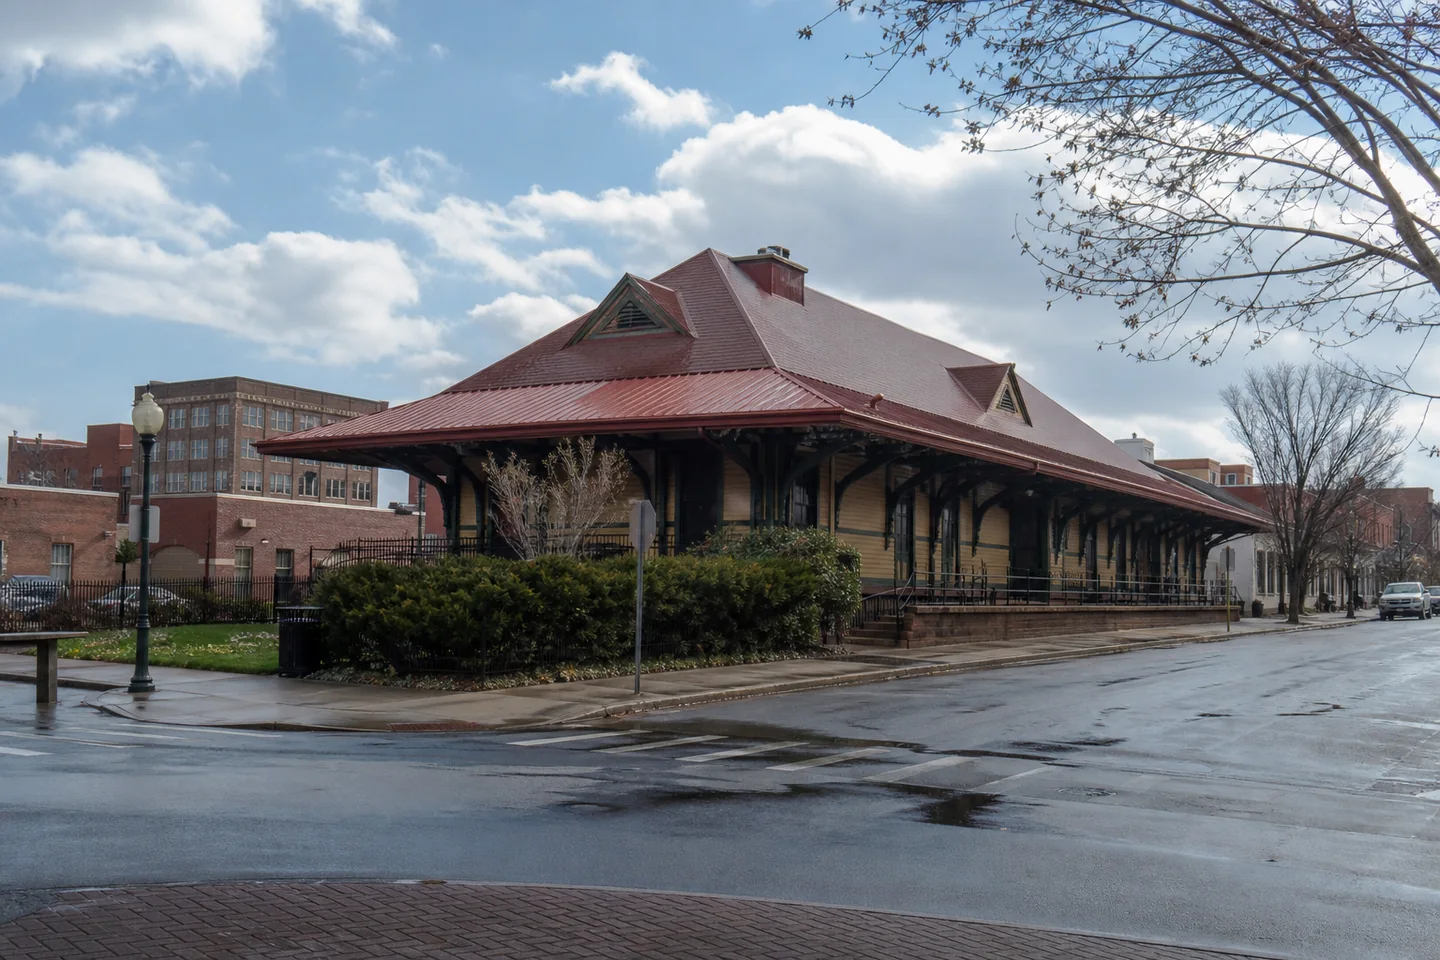
Smaller cross-region economic centers with similar population scale and materially different yield, entry price, renter pressure, housing form and demand evidence.
- Rapid City
- $368k · 4.7% yield
- Johnson City
- $300k · 5.9% yield
Cross-region cities with almost identical population scale but sharply different price, rent, yield, affordability, housing-stock and demand evidence.
- Upland
- $823k · 3.5% yield
- Bloomington
- $271k · 6.0% yield
Dense higher-cost city peers of similar scale whose direct records differ materially on affordability, renter pressure, housing stock and local-demand risk.
- Miami Beach
- $525k · 6.8% yield
- Evanston
- $496k · 6.2% yield

Cross-region midsize employment centers with nearly equal populations and materially different cost, yield, affordability, housing-stock and local-demand screens.
- Hickory
- $301k · 5.8% yield
- Wilkes-Barre
- $184k · 8.9% yield
Cross-region employment centers with similar population reach and materially different acquisition cost, yield, tenant-budget, housing-stock and demand screens.
- Framingham
- $682k · 4.2% yield
- Waterloo
- $149k · 7.2% yield

Cross-region education and employment centers of similar scale whose direct records differ materially across all six underwriting lenses.
- Towson
- $484k · 4.8% yield
- Corvallis
- $567k · 3.8% yield

Cross-region employment centers with comparable population scale and materially different acquisition cost, yield, affordability, housing stock and demand risk.
- Richland
- $470k · 4.6% yield
- Lorain
- $159k · 8.1% yield


Tourism-linked cross-region cities of similar population scale with materially different yield, renter pressure, housing-stock and local-demand evidence.
- Roswell
- $176k · 9.6% yield
- Niagara Falls
- $177k · 8.2% yield
Cross-region cities of similar population scale whose direct records produce different price, yield, renter-pressure, housing-form and local-demand decisions.
- Wauwatosa
- $435k · 4.7% yield
- Roswell
- $176k · 9.6% yield

Cross-region education-centered cities with similar population scale and different acquisition cost, yield, renter budgets, housing form and demand evidence.
- Rexburg
- $433k · 3.1% yield
- Urbana
- $210k · 7.1% yield