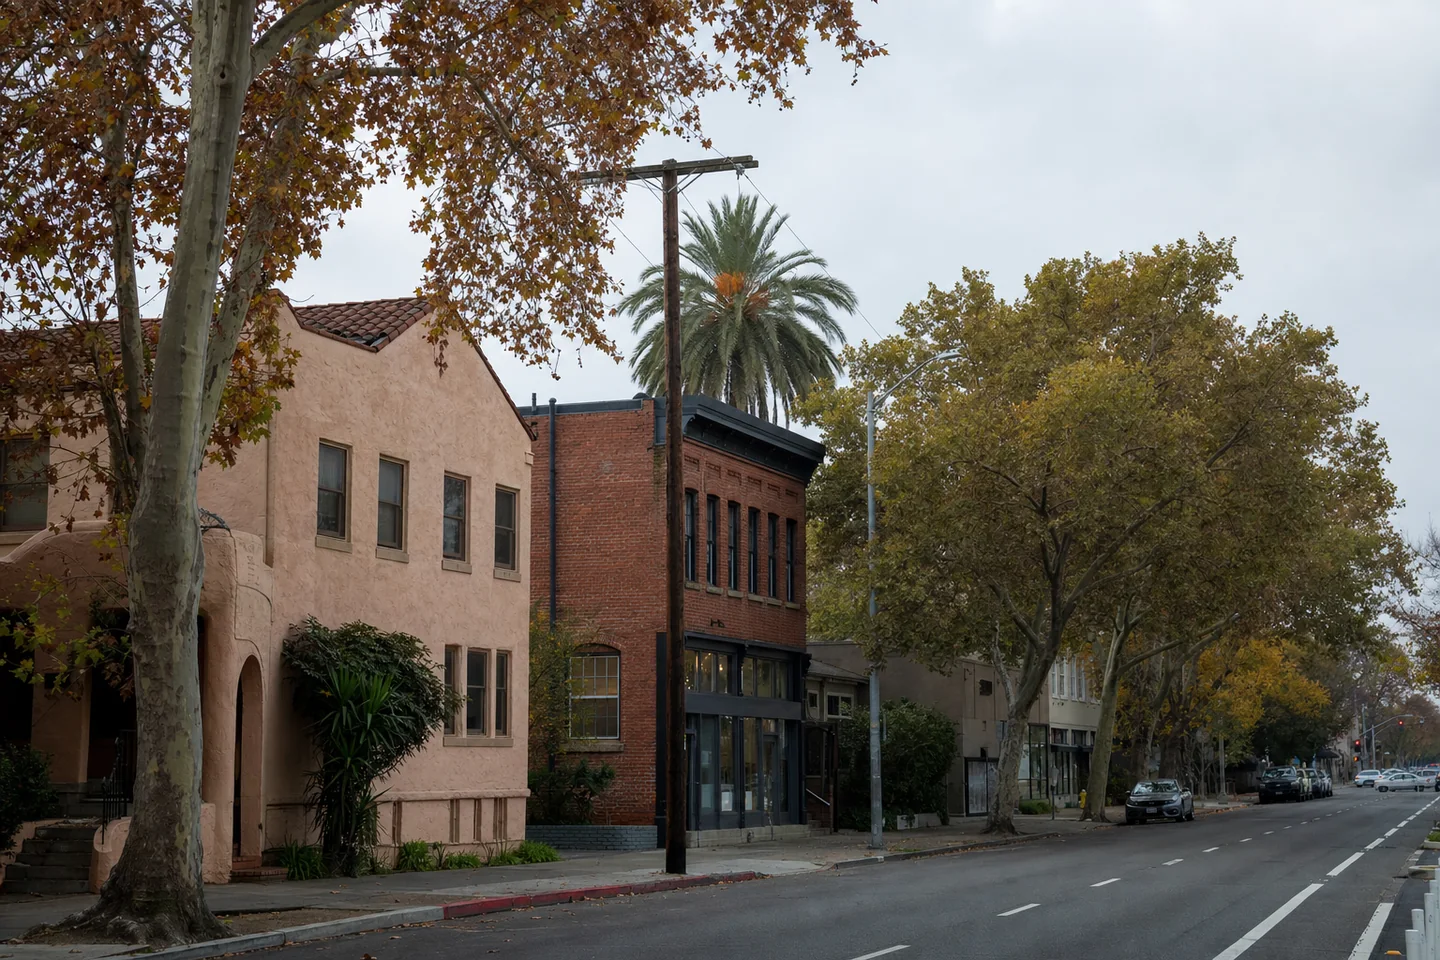
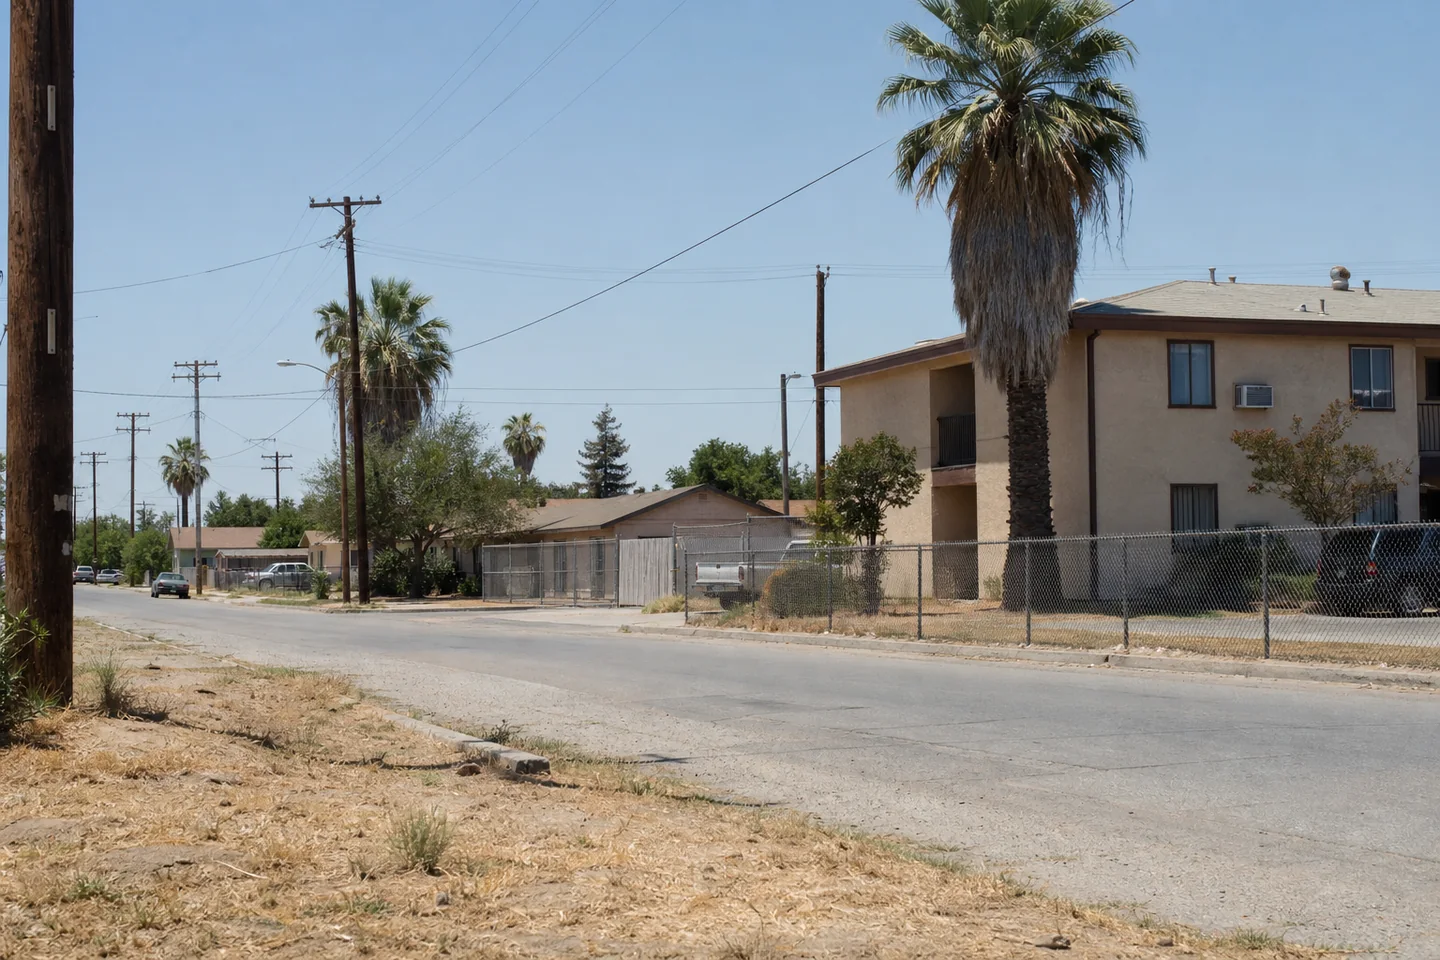
Fresno, CA better fits cash flow and entry affordability: its Zillow city index shows a $392,928.76 value and 5.97% gross yield, versus Sacramento, CA at $482,968.02 and 5.15%. That advantage is strictly pre-expense. Property underwriting should next test achievable unit rent, vacancy, taxes, insurance, repairs, management, financing and near-term capital work.
Fresno also shows stronger renter pressure, with a 49.87% renter share, 4.57% vacancy rate and 58.05% rent burden. Sacramento’s respective measures are 48.30%, 5.72% and 55.88%. These indicators can support occupancy, but Fresno’s burden also warns that rent growth may face household affordability constraints. Verify neighborhood vacancy, concessions, tenant turnover and income qualification at each candidate property.
Housing stock is a property-strategy question rather than a universal city advantage. Sacramento has a 65.89% single-family share and 11.28% large-multifamily share, while Fresno has 64.51% and 9.77%. For local demand, Sacramento better fits a resilience-oriented screen: population change was 5.54%, compared with Fresno’s 3.99%, and its unemployment rate was 6.56% versus 8.88%. Because population change compares overlapping ACS vintages and is not annualized, underwrite block-level employment access and leasing velocity before choosing either city.