
City limitsPlace boundary
Curated city comparison

FraminghamLawrence

Massachusetts city alternatives with comparable population scale and materially different acquisition cost, affordability, renter pressure, housing form and demand risk.

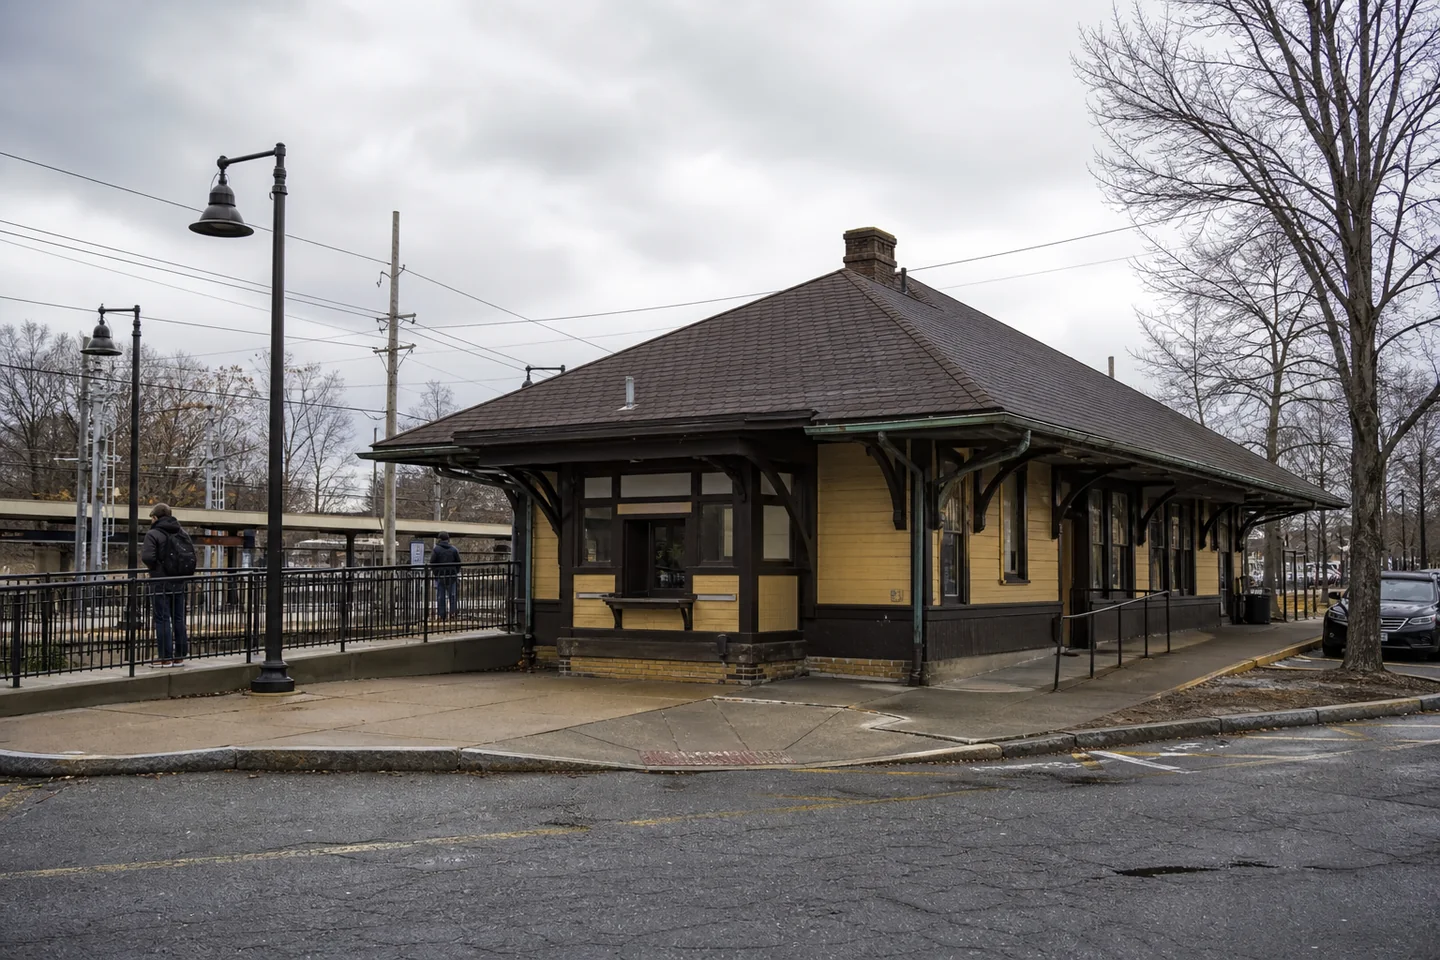
Framingham, MA cityscape
Lawrence, MA cityscape
Decision memo

The trade-off before property underwriting

The interpretation uses direct city records only. County and metro averages are not substituted into this comparison.

Framingham and Lawrence present a yield-versus-entry trade-off rather than a universal ranking. Lawrence’s Zillow gross yield is 5.4%, versus 4.2% in Framingham, and its Zillow city home-value index is $521,895 rather than $682,124. Their Zillow rent indexes are close at $2,347 and $2,360 per month. That makes Lawrence the stronger initial cash-flow screen, but gross yield excludes vacancy, management, repairs, taxes, insurance, utilities, financing and capital work. Before relying on that spread, obtain property-level rent, expense, condition and capex evidence.

Entry affordability depends on the constraint. Lawrence has the lower Zillow value index, but Framingham’s Zillow value-to-ACS household-income measure is 6.35, compared with 8.64 in Lawrence. Thus Lawrence better suits a smaller nominal acquisition budget; Framingham better fits a buyer focused on citywide price relative to surveyed household income. Zillow market indexes describe current modeled market levels, whereas ACS measures describe survey characteristics. They should not be averaged, and an ACS median rent or value is not a competing appraisal.

Lawrence has the clearer renter-pressure signal: 71.9% renter share and 2.2% vacancy, against Framingham’s 45.2% and 4.0%. Its 60.6% rent-burden measure, versus 53.4%, calls for tenant-income and collections review rather than automatic rent-growth underwriting. Lawrence’s population change is 11.0% across overlapping ACS vintages, compared with 0.1% in Framingham; it is not annualized. However, Lawrence’s 8.5% unemployment rate versus Framingham’s 4.8% makes local demand conditional. Check submarket leasing, employer exposure, unit turns and concession history property by property.

Direct city matrix

The same definition on both sides

“n/a” remains missing. Zillow indexes and ACS survey measures stay visibly separate.

Decision evidenceFramingham, MALawrence, MA
Typical home valueZillow ZHVI · city$682,124$521,895
Observed market rentZillow ZORI · city$2,360$2,347
Gross yieldZORI × 12 ÷ ZHVI · before costs4.2%5.4%
Price to household incomeZillow value ÷ ACS income6.35x8.64x
Annual rent to incomeZillow rent × 12 ÷ ACS income26.4%46.6%
Rent burdenACS renter households paying 30%+53.4%60.6%
Renter shareACS occupied housing45.2%71.9%
Vacancy rateACS all housing units4.0%2.2%
Population changebetween ACS vintages · not annualized▲ 0.1%▲ 11.0%
UnemploymentACS civilian labor force4.8%8.5%
Entry and income screen

Price, rent and yield do not tell the same story

Bars begin at zero within each measure. Gross yield remains a before-cost screen.

FraminghamLawrenceTypical home valueZillow ZHVI · city$682k$522kObserved market rentZillow ZORI · monthly city index$2k$2kGross yieldZORI × 12 ÷ ZHVI · before costs4.2%5.4%
Zillow city ZHVI and ZORI · 2026-06 / 2026-06
Price and rent history

Two city paths, each rebased to 100

Each panel keeps price and rent in its own city; no level is borrowed across geographies.

Five-year path

Price and rent, rebased to 100

ZHVI +22.3%ZORI +20.8%
12511095202120222023202420252026
Each series starts at 100 so their direction can be compared without pretending that a home value and a monthly rent share the same unit.
Five-year path

Price and rent, rebased to 100

ZHVI +33.5%ZORI +37.4%
13711695202120222023202420252026
Each series starts at 100 so their direction can be compared without pretending that a home value and a monthly rent share the same unit.
Fit by objective

There is no universal city winner

Five city questions remain separate so a yield lead cannot erase affordability or demand risk.

01
Cash-flow screenLawrence

Lawrence fits cash_flow better. Its Zillow gross yield is 5.4%, above Framingham’s 4.2%, and its Zillow rent index is $2,347 per month versus $2,360. Similar indexed rents alongside Lawrence’s lower value index support a stronger preliminary income screen. This is not net cash flow: Lawrence and Framingham still require unit-level checks of vacancy, management, repairs, taxes, insurance, utilities, financing and capital work.

02
Entry affordabilityDepends on the property

Lawrence better fits a buyer whose limiting factor is nominal acquisition cost, because its Zillow value index is $521,895, compared with $682,124 in Framingham. Framingham better fits a household-income affordability lens: its price-to-income measure is 6.35 compared with 8.64 for Lawrence. The next check is financing terms and down-payment capacity; neither city-level measure substitutes for a property appraisal.

03
Renter pressureLawrence

Lawrence fits renter_pressure better: its renter share is 71.9% and vacancy rate is 2.2%, compared with 45.2% and 4.0% in Framingham. But Lawrence also has a 60.6% rent-burden measure, versus 53.4% in Framingham. That combination signals demand pressure and affordability sensitivity, so inspect payment performance, renewal outcomes, concessions and legal rent constraints for the exact building.

04
Housing stockFramingham

Framingham fits housing_stock better if the intended purchase is a single-family asset or relatively newer building. Framingham’s single-family share is 57.0%, versus 26.8% in Lawrence, and its median year built is 1966 compared with 1950. Lawrence has a distinct, more renter-oriented stock mix, so verify the target property’s unit configuration, deferred maintenance, systems age and renovation scope.

05
Local demand riskDepends on the property

Lawrence’s population change is 11.0% across overlapping ACS vintages, while Framingham’s is 0.1%, supporting a stronger recent expansion signal. Yet Lawrence’s unemployment rate is 8.5% against 4.8% in Framingham, a material local-demand risk. Population change is not annualized. Underwrite employer concentration, resident incomes, leasing velocity and comparable concessions at the neighborhood and property level.

Household pressure

Acquisition and renter affordability

FraminghamLawrencePrice to incomeZillow value ÷ ACS household income6.4x8.6xRent to incomeAnnual Zillow rent ÷ ACS household income26.4%46.6%Rent-burdened householdsACS renters paying 30% or more53.4%60.6%
Zillow city indexes divided by direct ACS city household measures.
Housing system

Tenure, vacancy and structure

FraminghamLawrenceRenter shareACS occupied housing45.2%71.9%Vacancy rateACS all housing units4.0%2.2%Single-family stockACS one-unit structures57.0%26.8%Large multifamily stockACS structures with 20+ units19.6%16.1%
ACS citywide housing characteristics; not rentable inventory or lease-up speed.
Underwriting boundary

What this city comparison cannot decide

City evidence narrows a search; it does not appraise, inspect or finance a property.

  1. 01

    Zillow indexes are citywide modeled measures, not property sale quotes or signed leases. A specific Framingham or Lawrence building can diverge through location, condition, unit mix, lease terms and renovation requirements; obtain current comparable sales and rental comps.

  2. 02

    Gross yield is a screening measure only: it leaves out vacancy, management, repairs, taxes, insurance, utilities, financing and capital work. Obtain trailing operating statements, tax bills, insurance quotes, utility responsibility and a documented capital plan before comparing cash flow.

  3. 03

    ACS is a multiyear survey and household measures may lag current conditions; Zillow indexes and ACS measures answer different questions. Validate Lawrence’s burden and labor risks, and Framingham’s slower population signal, using property-level applicant, renewal and employment evidence.