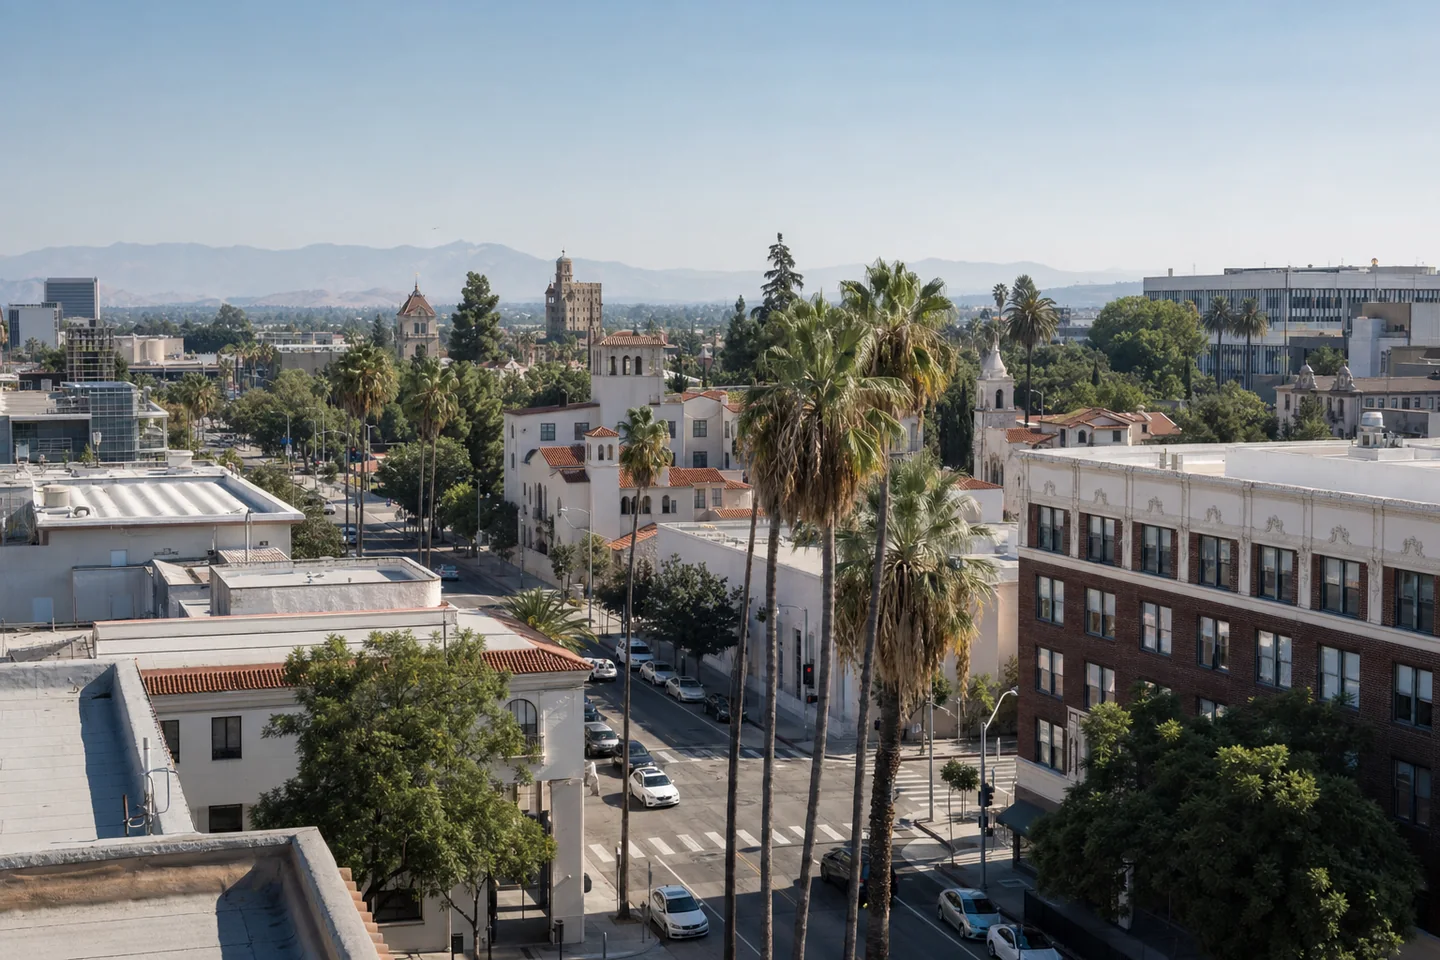
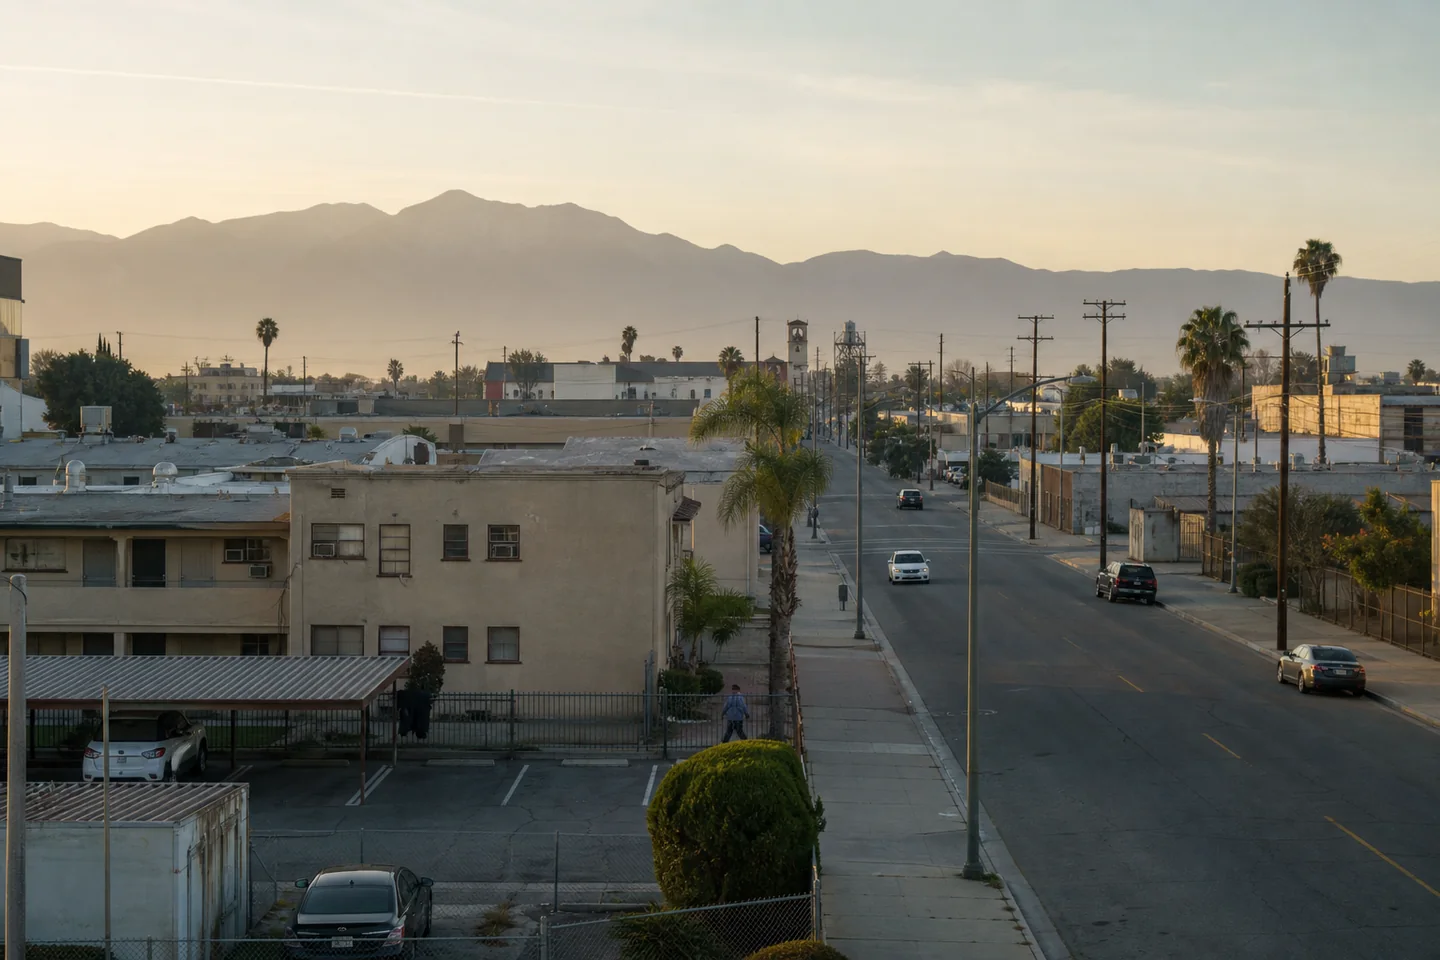
San Bernardino, CA merits the first look for cash flow and entry affordability, but not an automatic green light. Its Zillow city value index is $496,079.76 versus $648,360.36 in Riverside, CA, while gross yield is 4.82% versus 4.48%. That yield is only a screening measure before vacancy, management, repairs, taxes, insurance, utilities, financing and capital work.
San Bernardino also shows greater renter pressure: renters represent 50.01% of households, compared with 43.22% in Riverside, and its vacancy rate is 4.33% versus 4.74%. Yet the pressure has a material downside. San Bernardino’s rent-burden rate is 63.04%, poverty is 18.62%, and median household income is $67,415. Those indicators raise affordability and collection concerns, so its stronger leasing signals require tenant-income, arrears and turnover checks.
Riverside offers the more defensive demand and stock profile. Median household income is $91,045, poverty is 12.19%, and single-family homes represent 68.67% of stock. San Bernardino’s population change was 3.07%, while Riverside’s was -2.25%; these are changes across overlapping ACS vintages, not annualized growth rates. San Bernardino’s Zillow rent index also rose 3.73% year over year. Underwrite San Bernardino first for lower-basis yield, but verify collections and deferred maintenance; underwrite Riverside first when household capacity and single-family positioning matter more.