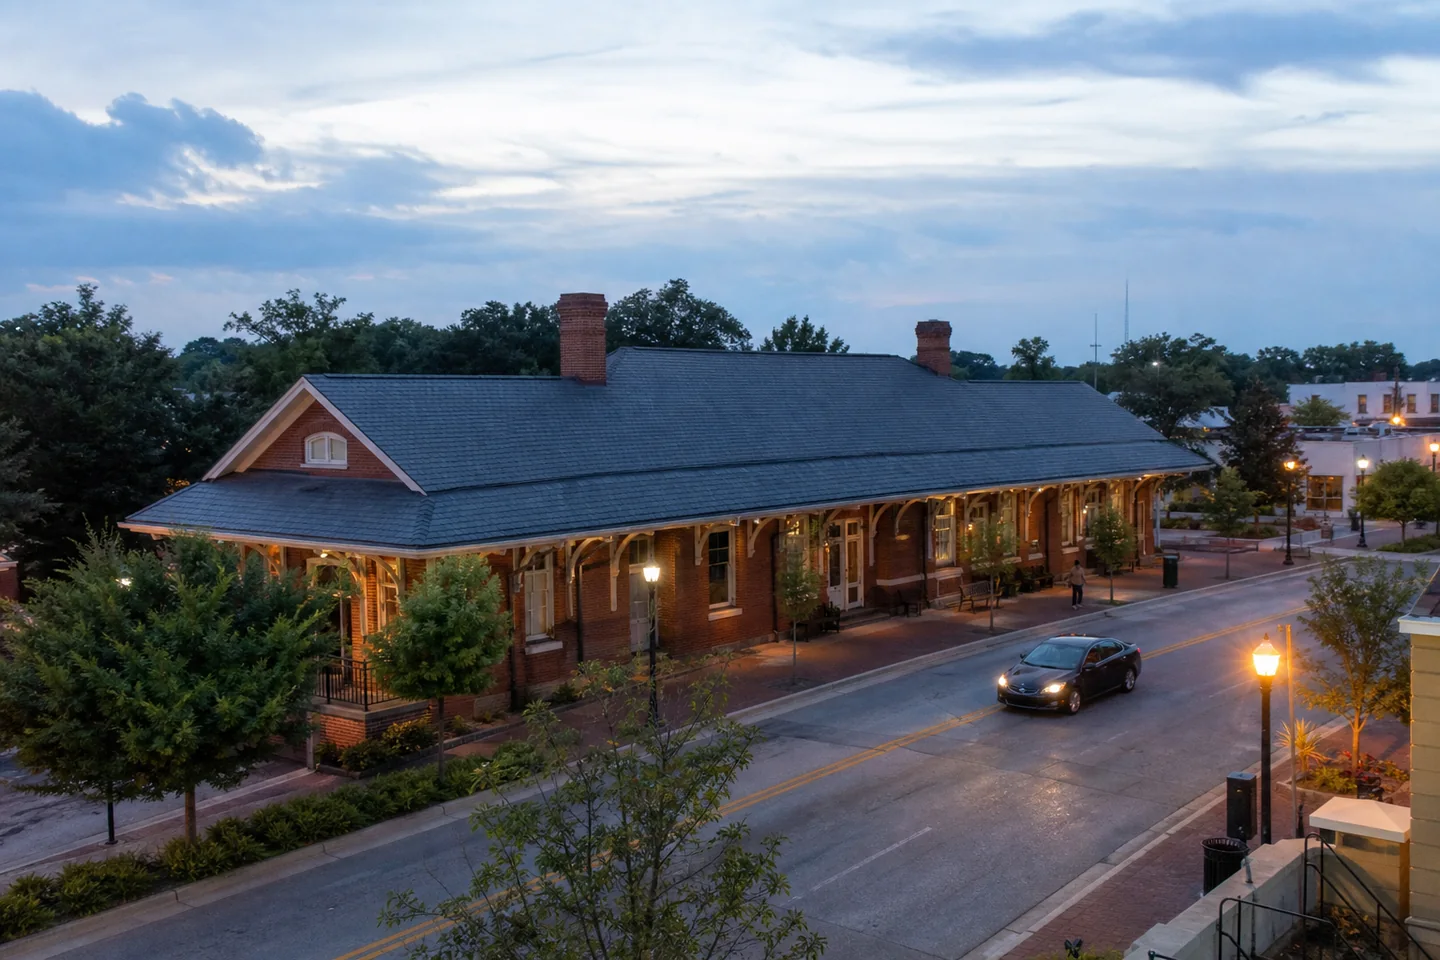
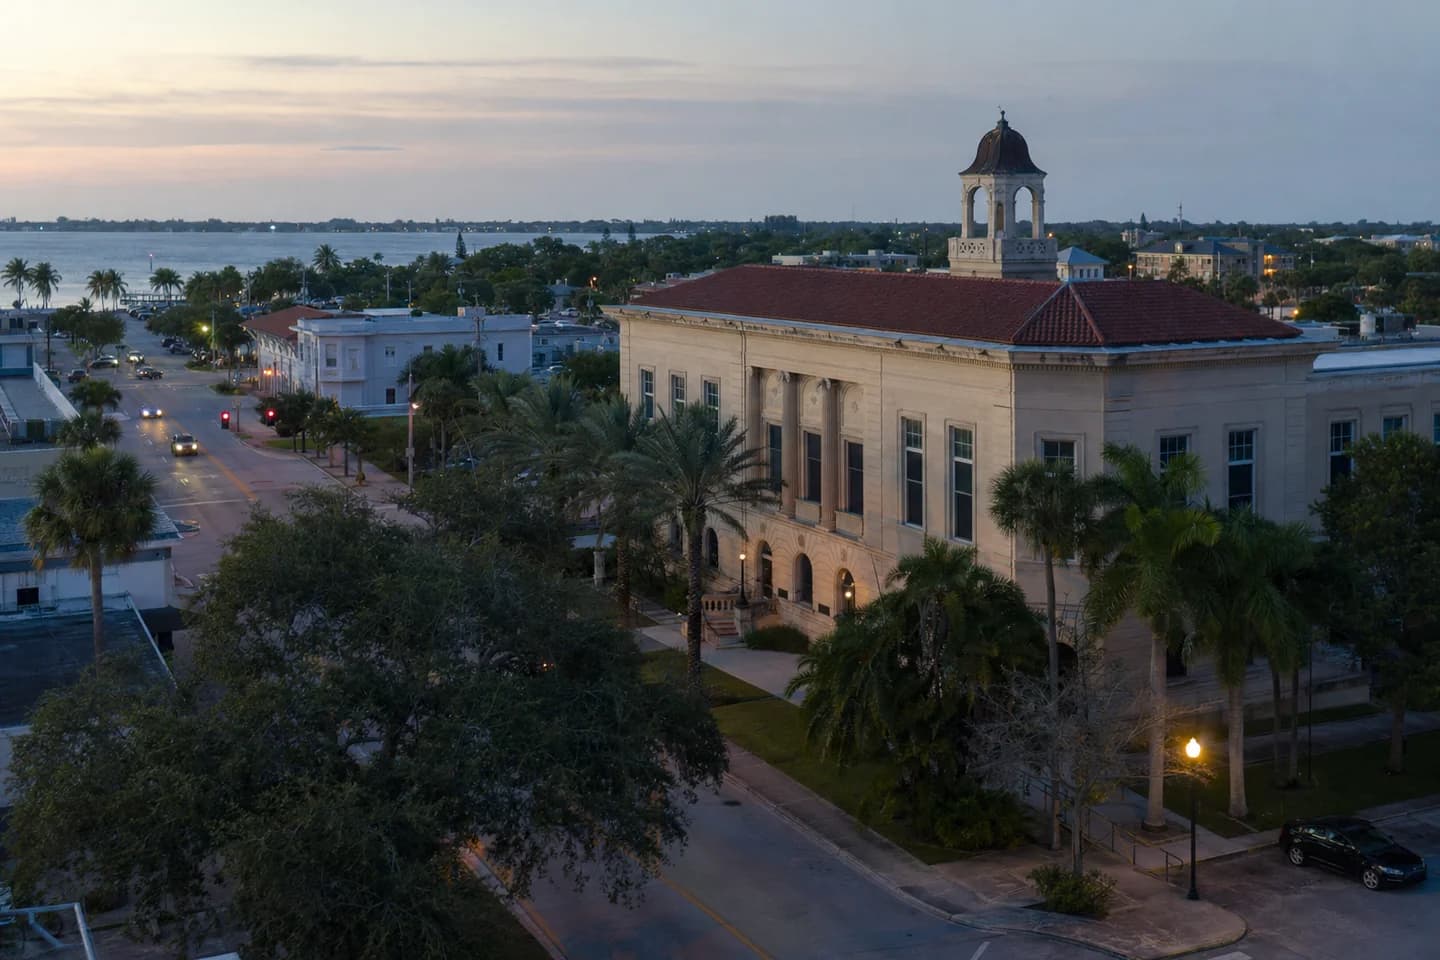
Greer, SC and Fort Pierce, FL warrant different underwriting screens rather than a blanket ranking. Fort Pierce’s 8.4% Zillow-index gross yield exceeds Greer’s 5.8%, so Fort Pierce is the cash-flow lead at the published pre-cost level. Yet Greer’s price-to-income measure is 4.29, versus 5.91 in Fort Pierce, which makes Greer the better income-relative buyer-affordability setting despite Fort Pierce’s lower Zillow city home-value index. Gross yield excludes vacancy, management, repairs, taxes, insurance, utilities, financing and capital work.
Renter pressure is mixed. Greer’s ACS vacancy rate is 7.2%, below Fort Pierce’s 17.5%, supporting a tighter occupancy thesis; Fort Pierce, however, has the larger renter share and a 68.8% share of cost-burdened renters, versus 40.1% in Greer. That combination requires tenant, turnover and collection checks rather than declaring a general renter-demand winner. For housing-stock fit, Greer favors a detached-home program: 82.0% of units are single-family and the median build year is 2003. Fort Pierce offers more large-multifamily exposure at 12.6%, while its 1982 median build year raises the importance of a condition review.
Local demand evidence favors Greer: population change between overlapping ACS vintages is 34.6%, compared with 8.3% in Fort Pierce; this is not annualized. Greer also records 2.4% unemployment against 9.2% in Fort Pierce. Start property-level work with Greer when employment-linked demand and a newer detached inventory are priorities; open Fort Pierce files when basis and preliminary yield compensate for deeper occupancy and condition diligence. Verify unit-level asking rent, lease-up/renewal history, vacancy, insurance, taxes, repair scope, utility responsibility and financing; ACS survey measures describe residents and homes, while Zillow indexes track market pricing and rent, so neither is an appraisal.