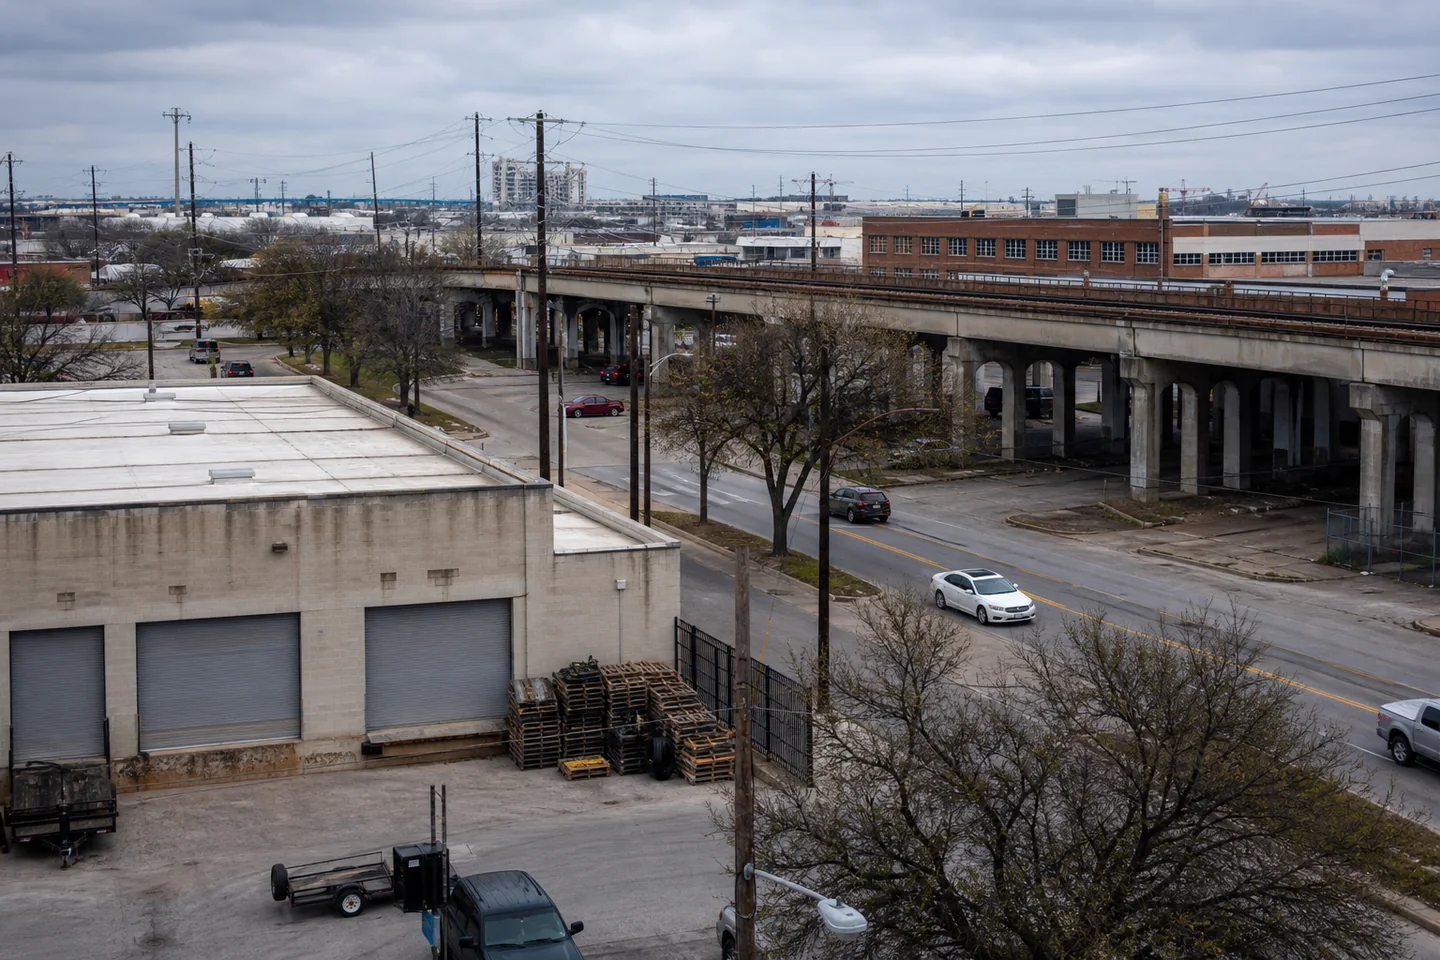
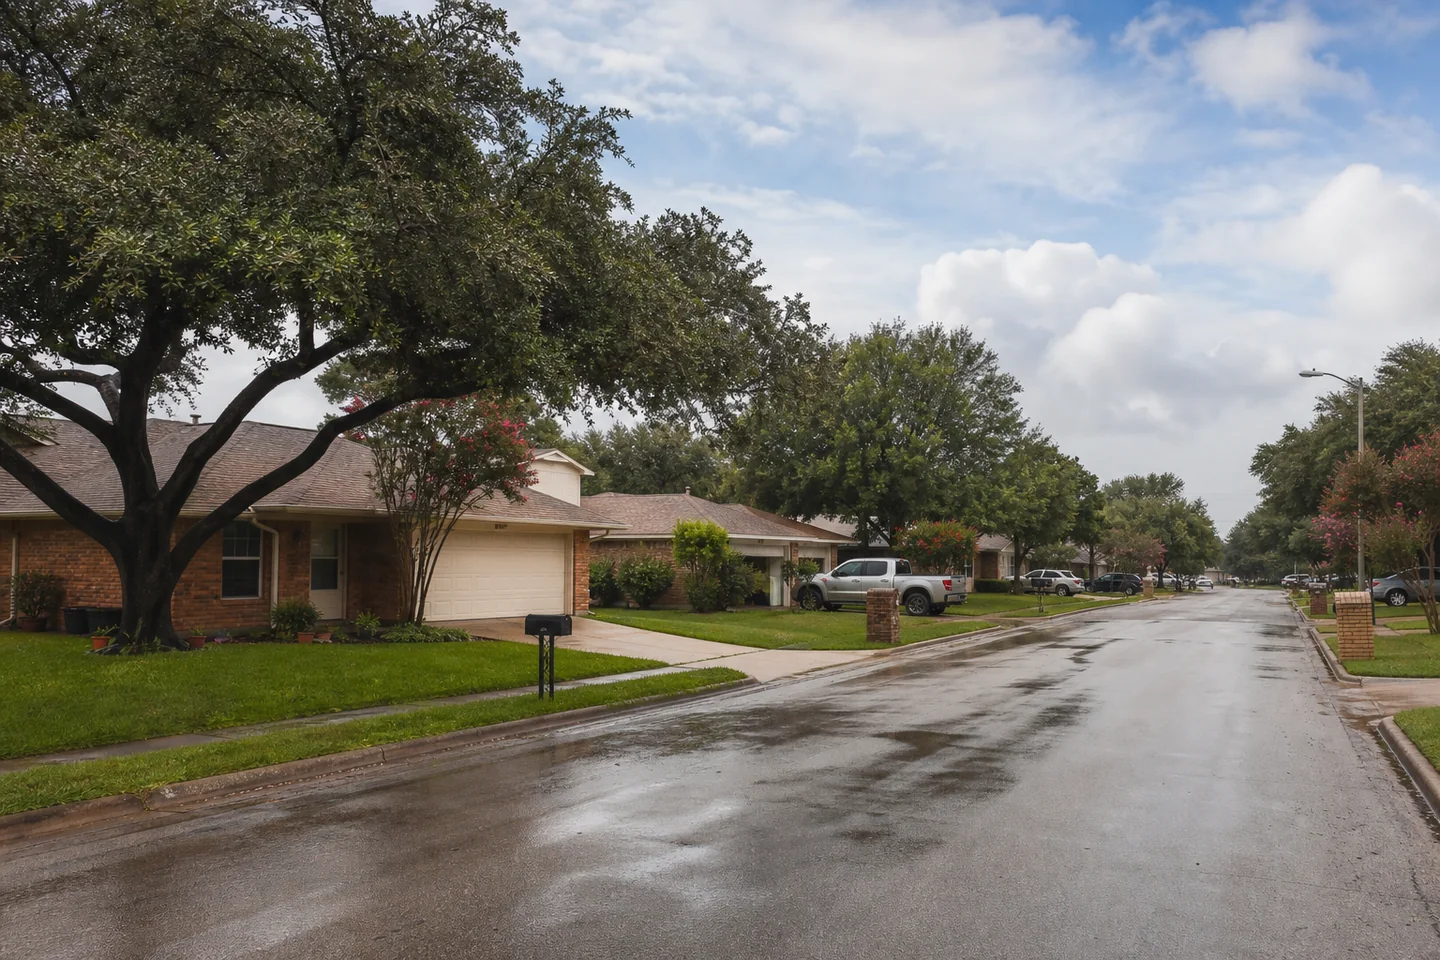
Dallas, TX better fits cash_flow on the city indexes: its Zillow rent is $1,618.11 against a $311,326.02 value, supporting a 6.24% gross yield. Arlington, TX posts $1,546.10 rent, a $314,440.00 value and a 5.90% gross yield. That is only a screening advantage. Gross yield excludes vacancy, management, repairs, taxes, insurance, utilities, financing and capital work, so property-level underwriting should next verify achievable rent, insurance, taxes and rehabilitation scope.
Entry affordability depends on the lens. Dallas has the lower Zillow value by $3,113.97, but Arlington has the lower price-to-income measure at 4.18 versus 4.41. Arlington better fits renter_pressure because its 6.98% vacancy rate is below Dallas’s 9.54%, while its rent-burden share is higher at 59.61%. Dallas nevertheless has a larger renter share, so the next check is submarket vacancy, concessions and tenant-income depth rather than assuming citywide pressure reaches every property.
Housing_stock depends on strategy. Arlington’s 66.15% single-family share better supports house-focused sourcing; Dallas’s 27.81% large-multifamily share better supports apartment-oriented screening. Local demand also splits: Arlington’s population change was positive at 0.57%, while Dallas recorded -1.70% across overlapping ACS vintages, not an annual rate. Dallas counters with lower unemployment at 4.91%. Give Arlington priority where household growth and tighter occupancy matter; give Dallas priority where higher screened yield, renter depth or multifamily inventory matters. In either city, test the exact block, unit condition, competing listings and tenant profile before advancing capital.