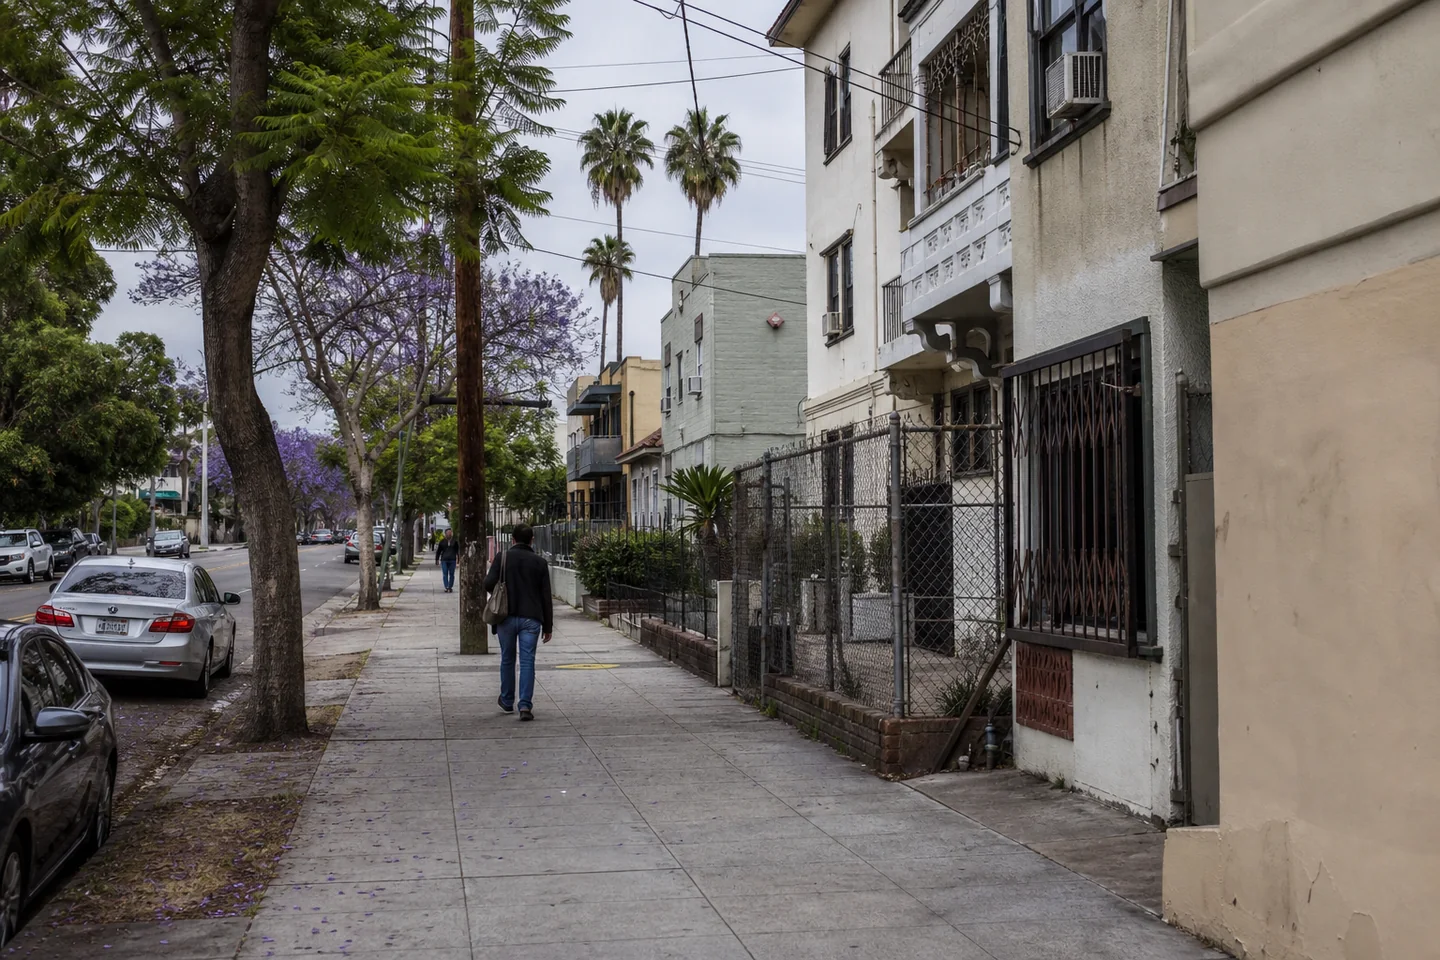
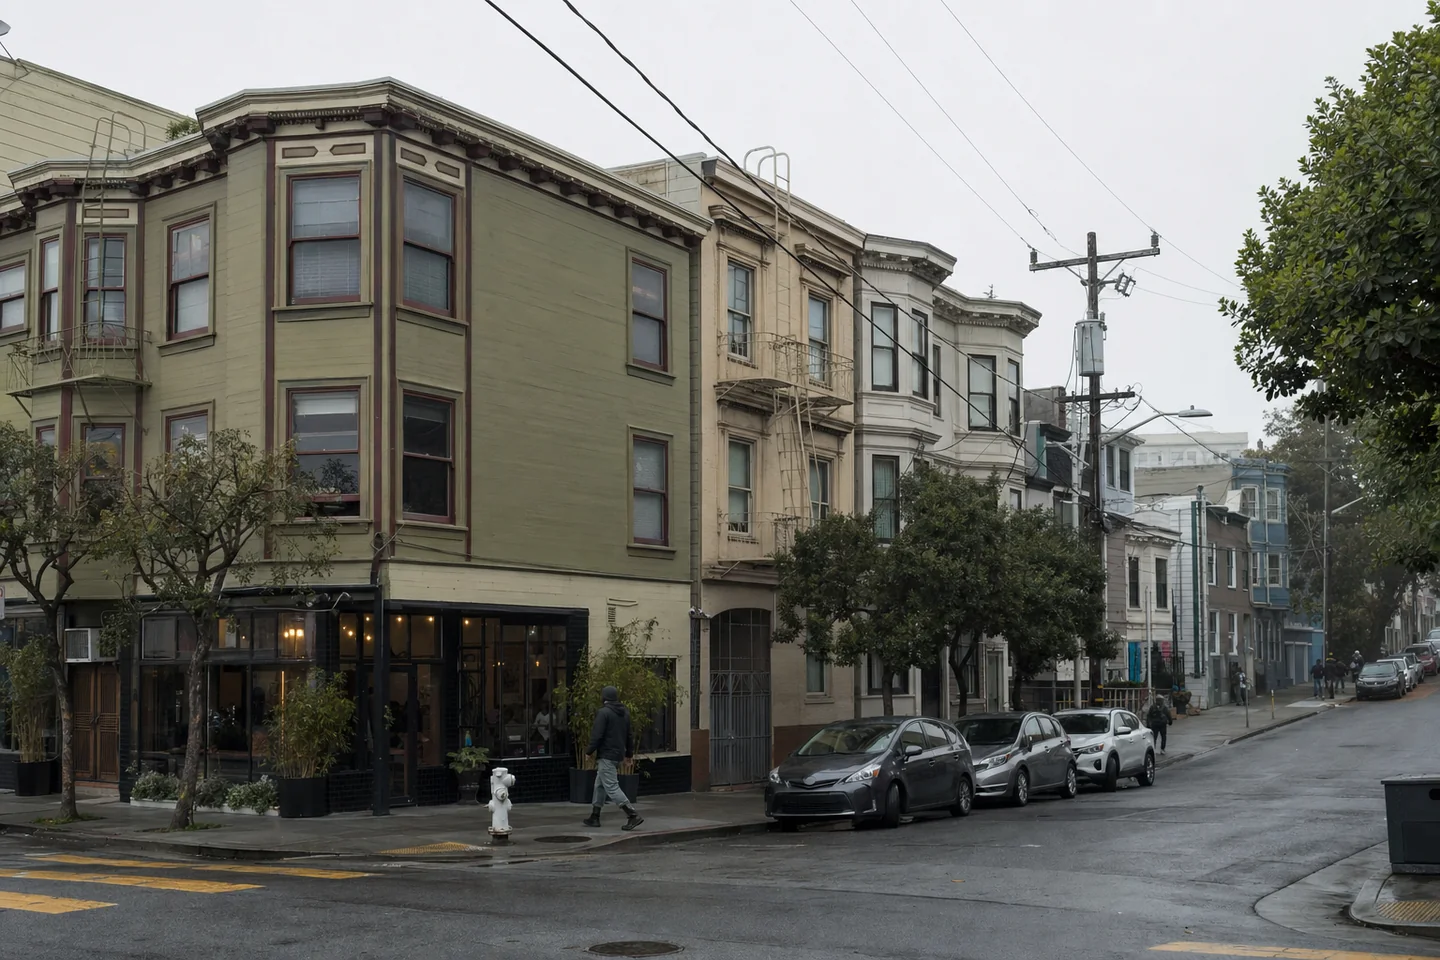
Los Angeles, CA better fits entry affordability and renter pressure, while San Francisco, CA offers the stronger headline cash-flow proxy. Los Angeles has a $949478.7471972201 Zillow value versus $1395852.0083535968 in San Francisco. San Francisco’s 0.03783586445490803 gross yield exceeds Los Angeles’s 0.03504896142172752, but that measure is before operating and financing costs.
Housing-stock fit depends on strategy. Los Angeles has a 0.4193402696463819 single-family share, while San Francisco’s median year built is 1946. San Francisco also has a 0.12212193863030087 vacancy rate, compared with 0.07413795765640803 in Los Angeles. Property-level underwriting should therefore test neighborhood vacancy, building condition, seismic and capital-work exposure, unit legality, and achievable lease rent rather than treating citywide indexes as a deal forecast.
Local demand is genuinely mixed, so neither city deserves an unconditional momentum verdict. San Francisco posts 0.20249956554483295 Zillow rent growth and 0.0947929848173592 home-value growth, but its overlapping-ACS population change is -0.0511177069606531. Los Angeles shows only 0.007464135966128271 rent growth and -0.006511337364047631 value growth, yet its population change is less negative at -0.027646778269172945. Underwrite San Francisco only if submarket evidence confirms that recent pricing momentum can withstand the sharper population contraction; favor Los Angeles where demand durability matters more than rapid index growth.