
City limitsPlace boundary
Curated city comparison

WauwatosaRoswell

Cross-region cities of similar population scale whose direct records produce different price, yield, renter-pressure, housing-form and local-demand decisions.

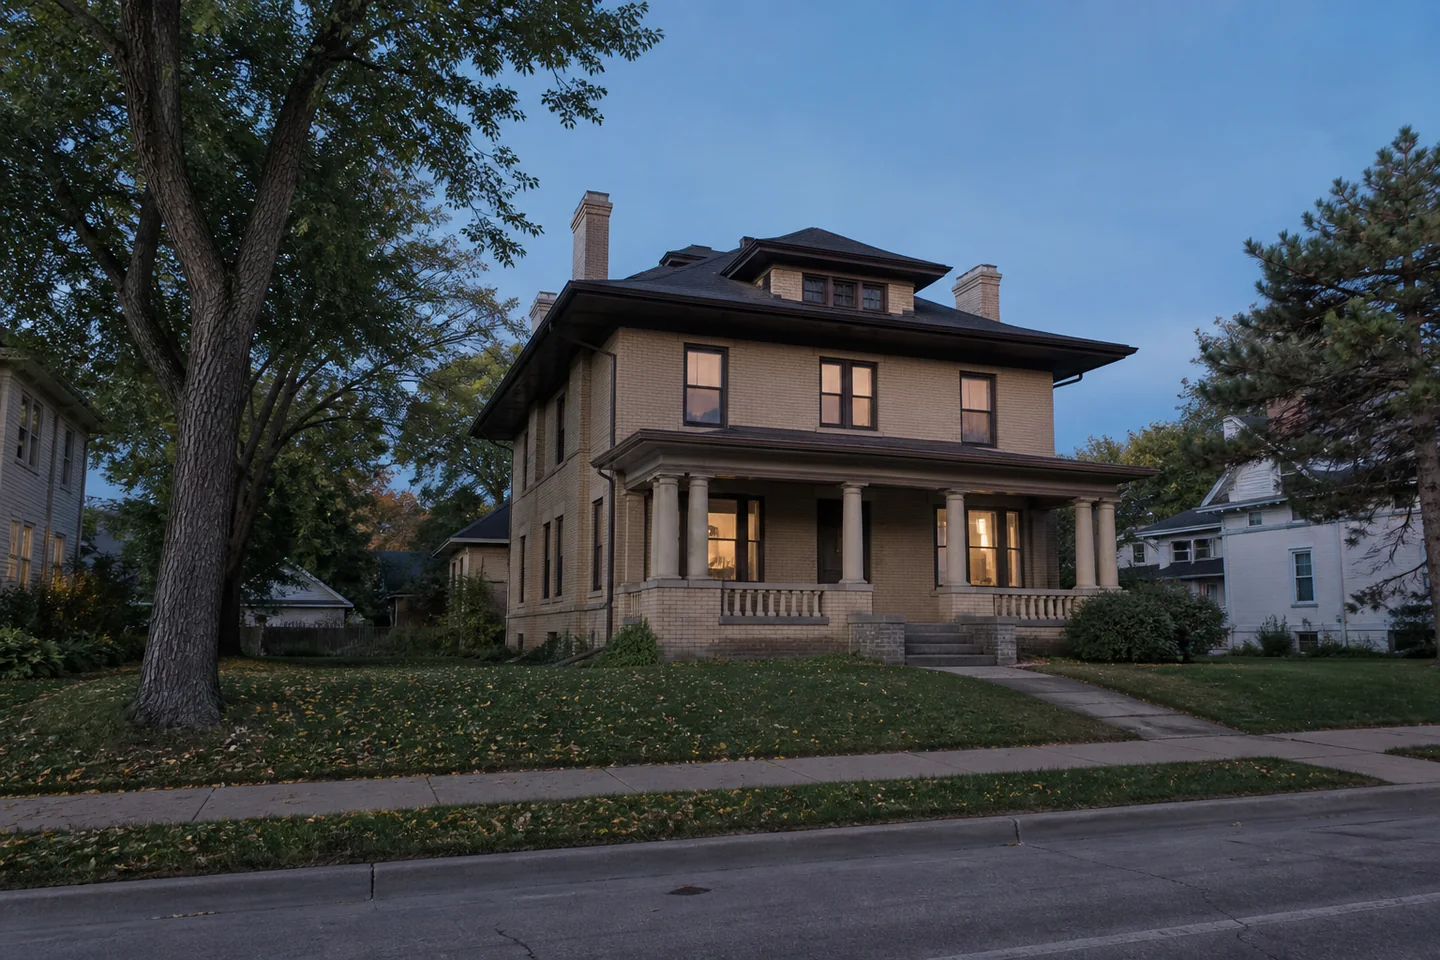
Wauwatosa, WI cityscape
Roswell, NM cityscape
Decision memo

The trade-off before property underwriting

The interpretation uses direct city records only. County and metro averages are not substituted into this comparison.

Wauwatosa, WI and Roswell, NM warrant different underwriting screens rather than a single ranking. Roswell’s Zillow city rent and home-value indexes produce a 9.55% gross yield against 4.75% in Wauwatosa, and its rent index rose 7.03% year over year versus 1.86%. That is a cash-flow lead at entry, not a net-return claim: gross yield excludes vacancy, management, repairs, taxes, insurance, utilities, financing and capital work.

Roswell’s 175,685 Zillow value index is below Wauwatosa’s 435,497, favoring a lower-cost acquisition screen. But Roswell’s 49.6% ACS rent-burden rate and 32.5% rent-to-income measure exceed Wauwatosa’s 43.1% and 20.4%. These affordability stresses qualify Roswell’s yield and rent-growth case; verify in-place collections, concessions, lease renewals and tenant incomes before treating index growth as durable cash flow.

Wauwatosa has the stronger local-demand screen: population changed 1.16% across overlapping ACS vintages, versus -0.63% in Roswell; this comparison is not annualized. Its unemployment rate was 2.09% rather than 5.00%. Wauwatosa’s 20.3% large-multifamily share contrasts with Roswell’s 4.9%, while Roswell’s 77.0% single-family share signals a different asset search. Citywide vacancy rates are not rental-specific availability measures, and the ACS survey is not contemporaneous with the Zillow period. Next, inspect property-level unit mix, rent roll, turnover, condition and comparable leases.

Direct city matrix

The same definition on both sides

“n/a” remains missing. Zillow indexes and ACS survey measures stay visibly separate.

Decision evidenceWauwatosa, WIRoswell, NM
Typical home valueZillow ZHVI · city$435,497$175,685
Observed market rentZillow ZORI · city$1,722$1,399
Gross yieldZORI × 12 ÷ ZHVI · before costs4.7%9.6%
Price to household incomeZillow value ÷ ACS income4.31x3.41x
Annual rent to incomeZillow rent × 12 ÷ ACS income20.4%32.5%
Rent burdenACS renter households paying 30%+43.1%49.6%
Renter shareACS occupied housing39.2%31.4%
Vacancy rateACS all housing units5.5%10.8%
Population changebetween ACS vintages · not annualized▲ 1.2%▼ 0.6%
UnemploymentACS civilian labor force2.1%5.0%
Entry and income screen

Price, rent and yield do not tell the same story

Bars begin at zero within each measure. Gross yield remains a before-cost screen.

WauwatosaRoswellTypical home valueZillow ZHVI · city$435k$176kObserved market rentZillow ZORI · monthly city index$2k$1kGross yieldZORI × 12 ÷ ZHVI · before costs4.7%9.6%
Zillow city ZHVI and ZORI · 2026-06 / 2026-06
Price and rent history

Two city paths, each rebased to 100

Each panel keeps price and rent in its own city; no level is borrowed across geographies.

Five-year path

Price and rent, rebased to 100

ZHVI +30.6%ZORI +27.6%
13111395202120222023202420252026
Each series starts at 100 so their direction can be compared without pretending that a home value and a monthly rent share the same unit.
Five-year path

Price and rent, rebased to 100

ZHVI +4.6%ZORI +24.1%
12411095202120222023202420252026
Each series starts at 100 so their direction can be compared without pretending that a home value and a monthly rent share the same unit.
Fit by objective

There is no universal city winner

Five city questions remain separate so a yield lead cannot erase affordability or demand risk.

01
Cash-flow screenRoswell

Roswell, NM fits cash_flow when gross entry yield is the screen: its Zillow-based gross yield is 9.55%, versus 4.75% in Wauwatosa, WI, and Roswell’s rent-index growth is 7.03% versus 1.86%. The counterweight is tenant affordability: Roswell’s rent-burden rate is 49.6% and its rent-to-income measure is 32.5%, above Wauwatosa’s 43.1% and 20.4%. Underwrite actual collections, concessions, turnover and every operating and capital cost; gross yield excludes them.

02
Entry affordabilityRoswell

Roswell, NM fits entry_affordability because its Zillow city home-value index is 175,685, below Wauwatosa, WI at 435,497. Its reported price-to-income measure is 3.41 compared with 4.31. This is a lower-price acquisition screen, not proof that a specific house is affordable or readily financeable. Before bidding in Roswell, inspect property condition, insurability, taxes and the asking price against local comparable listings; use Wauwatosa’s higher entry level only where the asset case supports it.

03
Renter pressureDepends on the property

Wauwatosa, WI has a 39.2% renter share against 31.4% in Roswell, NM. Roswell’s 49.6% rent-burden rate and 32.5% rent-to-income measure flag affordability stress, compared with 43.1% and 20.4% in Wauwatosa. Wauwatosa’s 5.5% and Roswell’s 10.8% citywide vacancy rates come from the ACS survey rather than the Zillow rent-index period; they are not contemporaneous, cover all housing and do not establish rental availability or current leasing pressure. Check submarket vacancy, concessions and lease traffic.

04
Housing stockDepends on the property

Housing_stock depends on intended product. Roswell, NM better matches a single-family strategy: 77.0% of its units are single-family, compared with 58.0% in Wauwatosa, WI. Wauwatosa better matches larger multifamily targeting, with a 20.3% large-multifamily share versus 4.9% in Roswell. The median year built is 1954 in Wauwatosa and 1968 in Roswell, so property-level condition can outweigh city form. Check unit configuration, deferred maintenance, utility responsibility and renovation scope before selecting either.

05
Local demand riskWauwatosa

Wauwatosa, WI fits local_demand more closely. Its population change is 1.16% across overlapping ACS vintages, compared with -0.63% in Roswell, NM; this comparison is not annualized. Wauwatosa also has a 2.09% unemployment rate and 5.8% poverty rate, versus 5.00% and 26.0% in Roswell. These indicators favor a stronger demand screen, but do not establish neighborhood-level tenant demand. Verify employer exposure, commute positioning, school or amenity appeal and competing supply around the specific property.

Household pressure

Acquisition and renter affordability

WauwatosaRoswellPrice to incomeZillow value ÷ ACS household income4.3x3.4xRent to incomeAnnual Zillow rent ÷ ACS household income20.4%32.5%Rent-burdened householdsACS renters paying 30% or more43.1%49.6%
Zillow city indexes divided by direct ACS city household measures.
Housing system

Tenure, vacancy and structure

WauwatosaRoswellRenter shareACS occupied housing39.2%31.4%Vacancy rateACS all housing units5.5%10.8%Single-family stockACS one-unit structures58.0%77.0%Large multifamily stockACS structures with 20+ units20.3%4.9%
ACS citywide housing characteristics; not rentable inventory or lease-up speed.
Underwriting boundary

What this city comparison cannot decide

City evidence narrows a search; it does not appraise, inspect or finance a property.

  1. 01

    The Zillow city home-value and rent indexes are market indexes, not an appraisal, asking rent, signed lease, or a property’s condition-adjusted value. They should guide a comparable-sale and comparable-rent check rather than set the underwriting price or rent.

  2. 02

    The ACS survey measures reflect their stated multi-year survey vintage and are not contemporaneous with the Zillow index period. In particular, the citywide vacancy rate covers all vacant housing units, not rental vacancies, so it cannot measure rental availability or lease-up conditions.

  3. 03

    Gross yield is a pre-cost screen based on city Zillow rent and value indexes. It omits vacancy, management, repairs, taxes, insurance, utilities, financing, and capital work; property taxes, insurance quotes, condition, rent roll, and expense history must be obtained for each candidate.