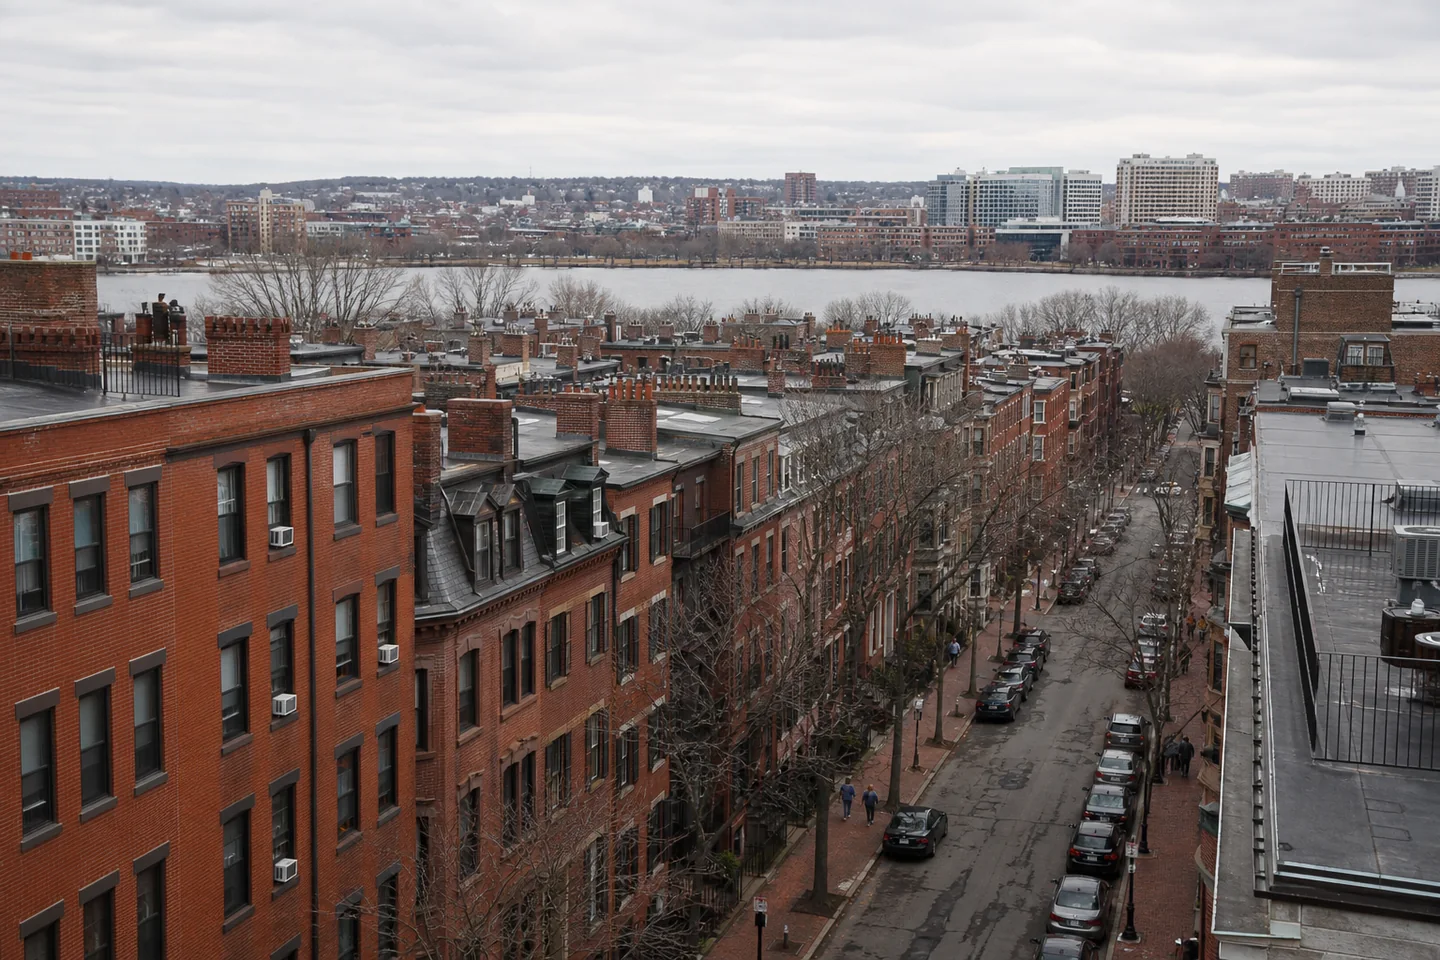

Worcester, MA better fits initial cash-flow and entry-affordability screening: its Zillow value is $443,386.61 versus Boston, MA at $788,881.28, while gross yield is 5.86% versus 5.28%. Boston’s higher $3,469.07 Zillow rent does not offset its steeper acquisition benchmark. Underwrite Worcester properties first for operating expenses, achievable unit rents and deferred capital work rather than treating gross yield as net return.
Renter pressure depends on the signal selected. Boston has a 64.30% renter share and 8.77% vacancy, while Worcester has 57.25% renters and 7.42% vacancy. Worcester’s 54.24% rent-burden rate exceeds Boston’s 51.20%, indicating greater affordability strain, not automatically greater rent-growth capacity. Boston better fits a large-multifamily search, whereas Worcester better fits a single-family-oriented search. Parcel-level checks should confirm unit mix, legal occupancy and comparable leasing velocity.
Local demand also separates the strategies. Worcester better fits population momentum because its overlapping-vintage ACS change is 11.84%, while Boston’s is -2.62%; neither figure is annualized. Boston nevertheless offers the larger city population and stronger household income, so demand quality cannot be reduced to direction of change alone. Review neighborhood population patterns, employer exposure, concessions and current listings before advancing either city to property-level underwriting.