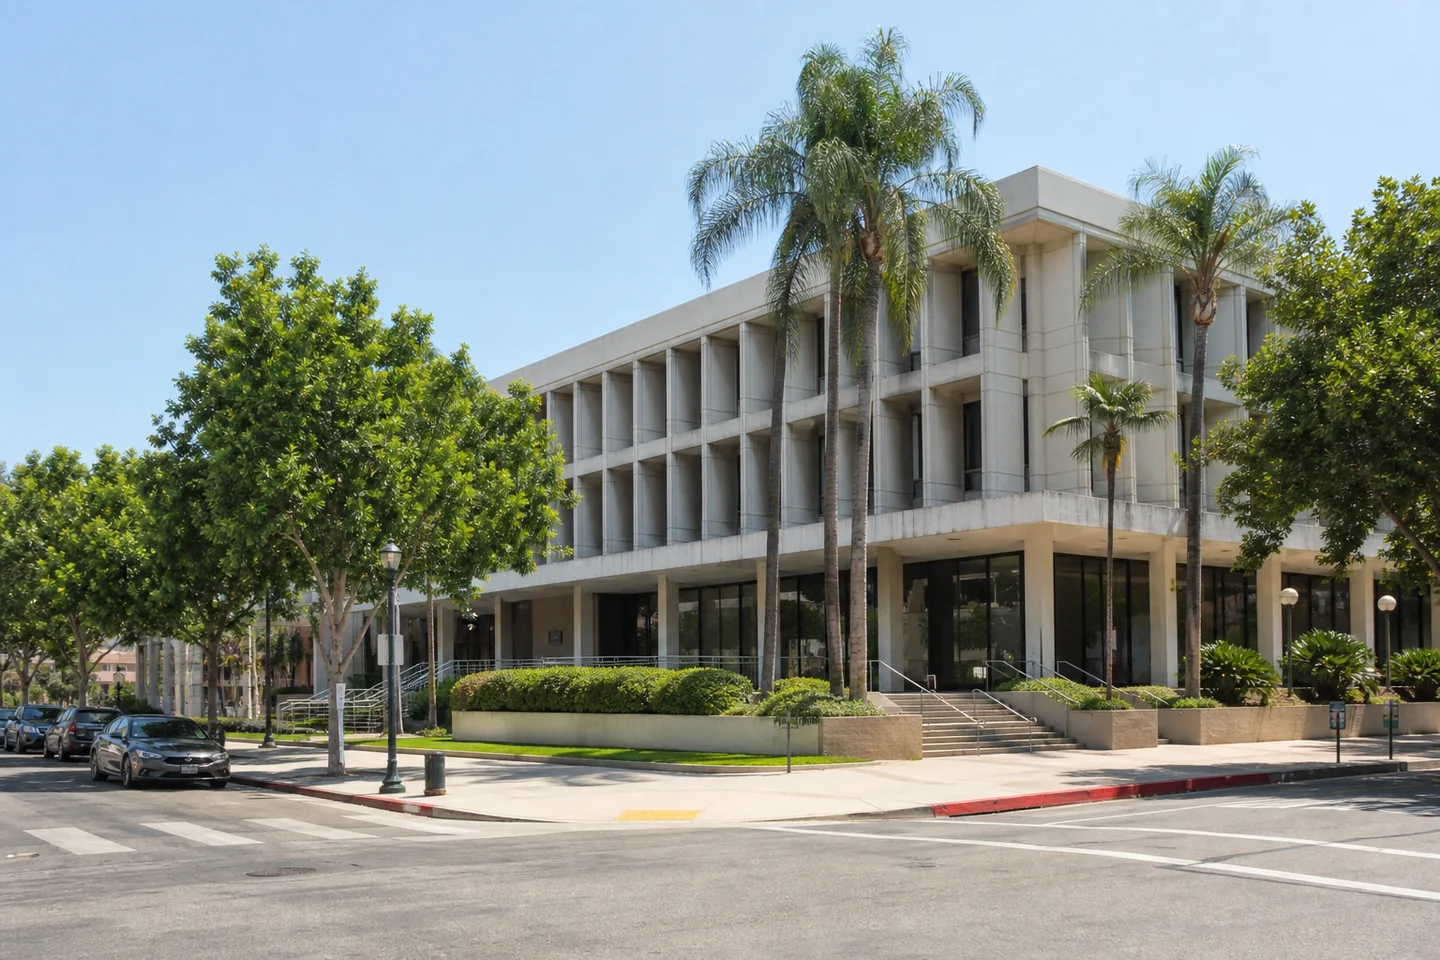
Fullerton’s current Zillow picture sets a high-entry-cost, low-unlevered-yield frame: ZHVI indicates a typical city home value of $1,053,680, while ZORI indicates typical observed market rent of $2,872 a month. That produces a 3.3% gross yield, before every operating cost. The Zillow value is 10.1x ACS median household income, and annualized ZORI equals 33.0% of that income, signaling meaningful affordability pressure without establishing any individual household’s budget.
Citywide stock totals 50,344 housing units; 48.2% of occupied units are renter-occupied, and the housing-stock vacancy rate is 4.4%. Those measures describe broad tenure and slack, not the leasing outlook for a selected property. ACS surveyed occupied housing reports a $902,600 median home value and $2,194 median gross rent, which includes contract rent plus selected utilities. These ACS measures differ in definition and period from Zillow’s typical value and observed market rent and must not be blended.
Direct city depth is mixed. The city rent-burden share is 62.4% at the 30%-or-more threshold. Single-family homes represent 60.4% of all units and large multifamily buildings 18.5%; these structure shares are survey context, not available inventory. Of units ACS classifies as vacant, 53.1% are for rent, but neither that reason share nor citywide vacancy proves fast lease-up. Population rose 1.0% between overlapping ACS five-year vintages; this is not annualized and may reflect boundary changes. Median household income is $104,286, while poverty is 12.3% and unemployment 6.3%, descriptive demand constraints rather than causes.
At the county scope, Orange County listings show a median 46 days on market and 18.2% with price reductions, useful sale-liquidity context but not city performance. In the broader Los Angeles metro, employment declined 0.1%, while permits totaled 36,862 in the supplied reporting period; metro labor and construction signals do not measure Fullerton demand or supply directly. At the national scope, the 30-year mortgage rate is 6.58%, a financing benchmark rather than a city borrowing quote.
Underwriting remains limited because city and wider-context aggregates cannot establish a property’s achievable rent, operating expenses, condition, insurability, financing terms, or resale timing. Before acting, verify the exact unit’s current lease and comparable asking and signed rents; inspect major systems and deferred maintenance; quote taxes, insurance, debt, utilities, management, repairs, and vacancy assumptions; check title, zoning, permits, and rental restrictions; and stress-test cash flow rather than treating gross yield as net return.