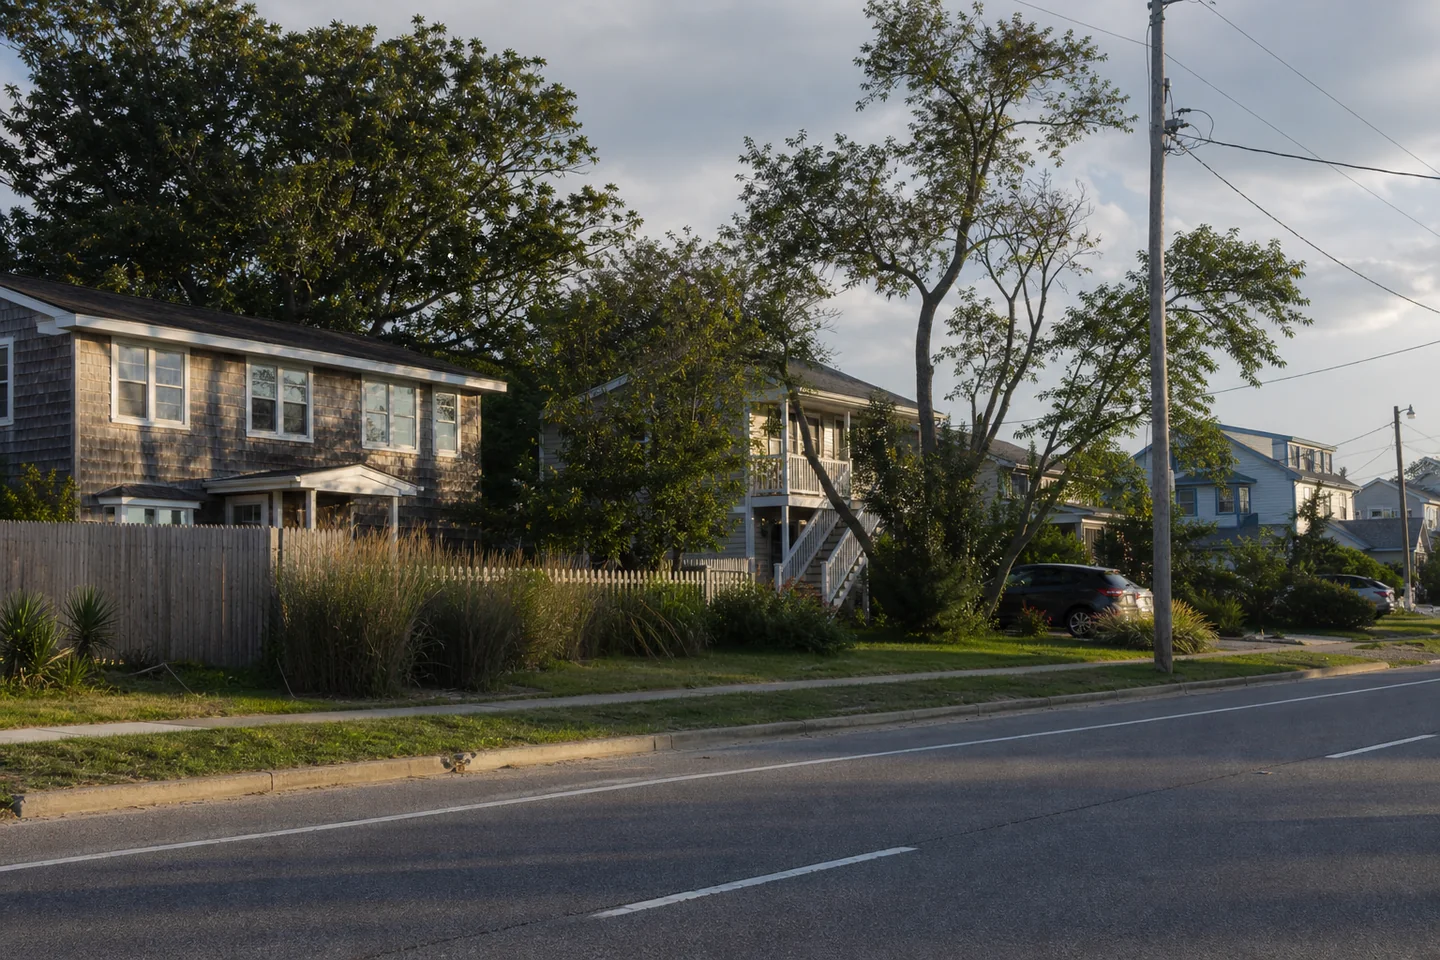
For Virginia Beach, Zillow reports a typical home value of $432,734 and typical observed monthly market rent of $2,065. Annualizing that rent against value gives a 5.7% gross yield before vacancy, management, maintenance, insurance, taxes, financing and capital work. The value is 4.65x ACS median household income, while annual Zillow rent equals 26.7% of that income; these are broad affordability screens, not a buyer’s payment or tenant-specific burden. Zillow value and rent rose 3.2% and 4.5% year over year, respectively, so rent growth recently exceeded value growth without establishing future performance.
City housing stock totals 191,294 units, of which 34.9% of occupied units are renter-occupied and 6.0% of all units are vacant. Single-family structures comprise 73.1% of units, versus 7.8% in large multifamily structures. ACS reports a $382,500 median owner-reported value for surveyed owner-occupied homes and $1,714 median gross rent for surveyed renter-occupied homes; gross rent includes contract rent and selected utilities. Those ACS measures differ in concept and period from Zillow’s typical value and observed market rent, so they should not be averaged or treated as direct discounts.
Citywide, 54.6% of renter households are rent-burdened, while poverty is 8.6% and unemployment 4.0%; these are demand constraints, not proof of causation or tenant quality. Of vacant units, 30.8% are listed for rent and 2,856 are seasonal, but ACS reasons do not measure immediately available investment inventory or leasing speed. Population grew 1.4% between overlapping ACS vintages, a comparison that is not annualized and may reflect boundary changes. Median household income is $92,968. These facts cannot establish achievable property rent, turnover, condition or tenant demand.
For Virginia Beach City county, 20.6% of listings were price-reduced, a county marketing signal rather than city transaction evidence. The broader Virginia Beach metro had 2.2 months of supply. Employment across the broader Virginia Beach metro was down 0.4% year over year. The national Freddie Mac 30-year mortgage rate was 6.58%, a national financing benchmark rather than a borrower-specific quote.
The gross-yield screen omits every operating cost and says nothing about net cash flow, financing resilience or resale liquidity. Before acting, verify the property’s purchase price, current lease and attainable rent with like-property evidence; inspect the roof, systems and deferred maintenance; obtain property-specific tax, insurance, hazard, utility, HOA and management quotes; and review vacancy, concessions, tenant payment history, title, permits and legal use. Stress-test debt service and capital reserves against realistic downtime and repairs rather than applying city, county or metro averages to the asset.