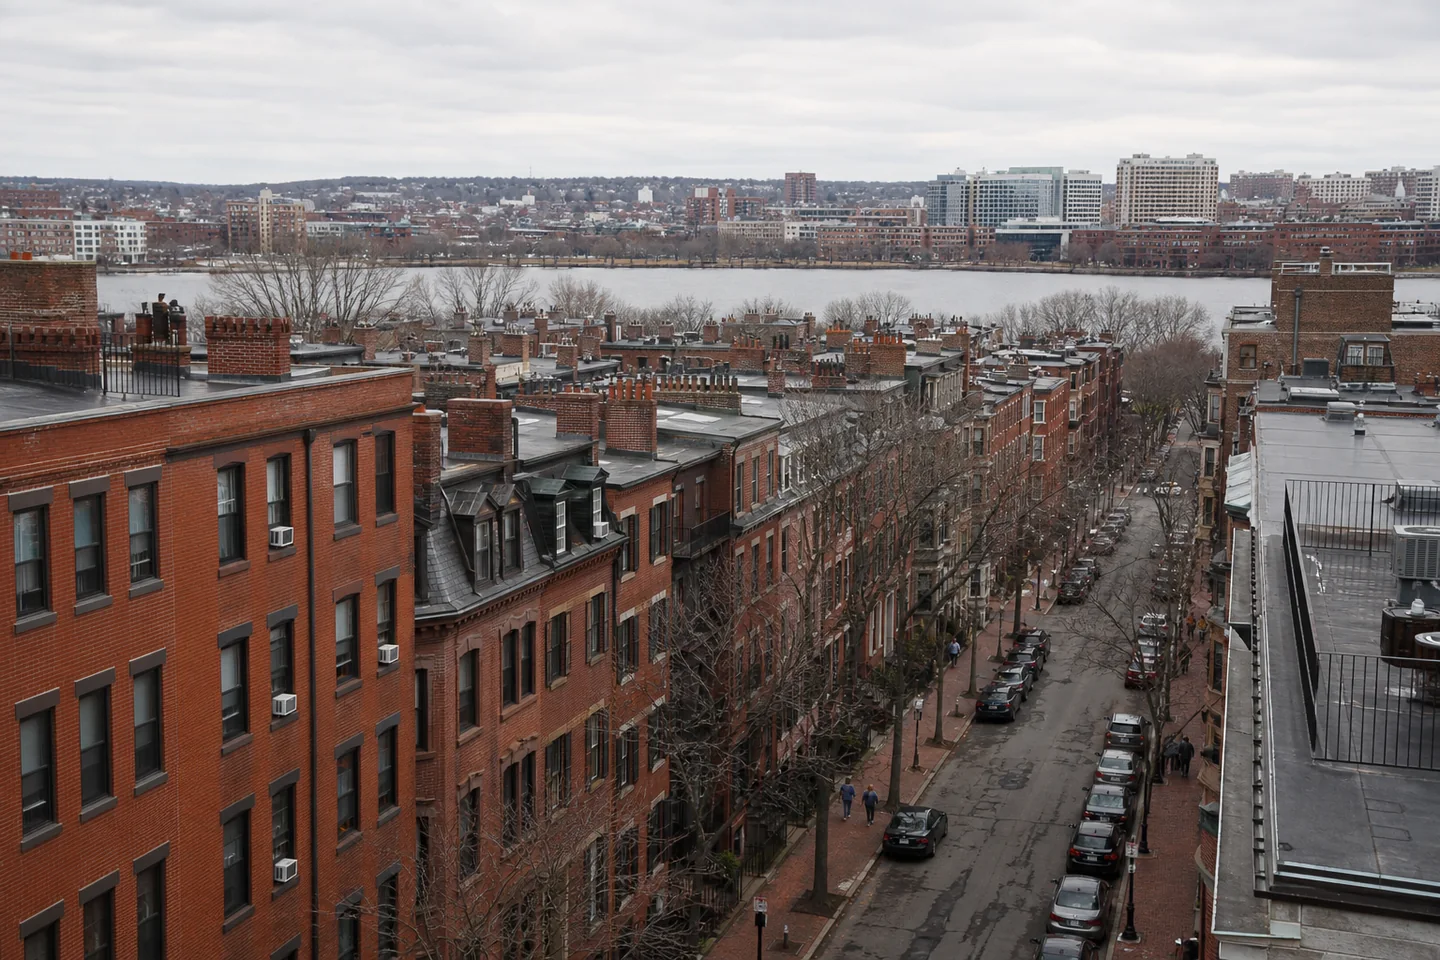
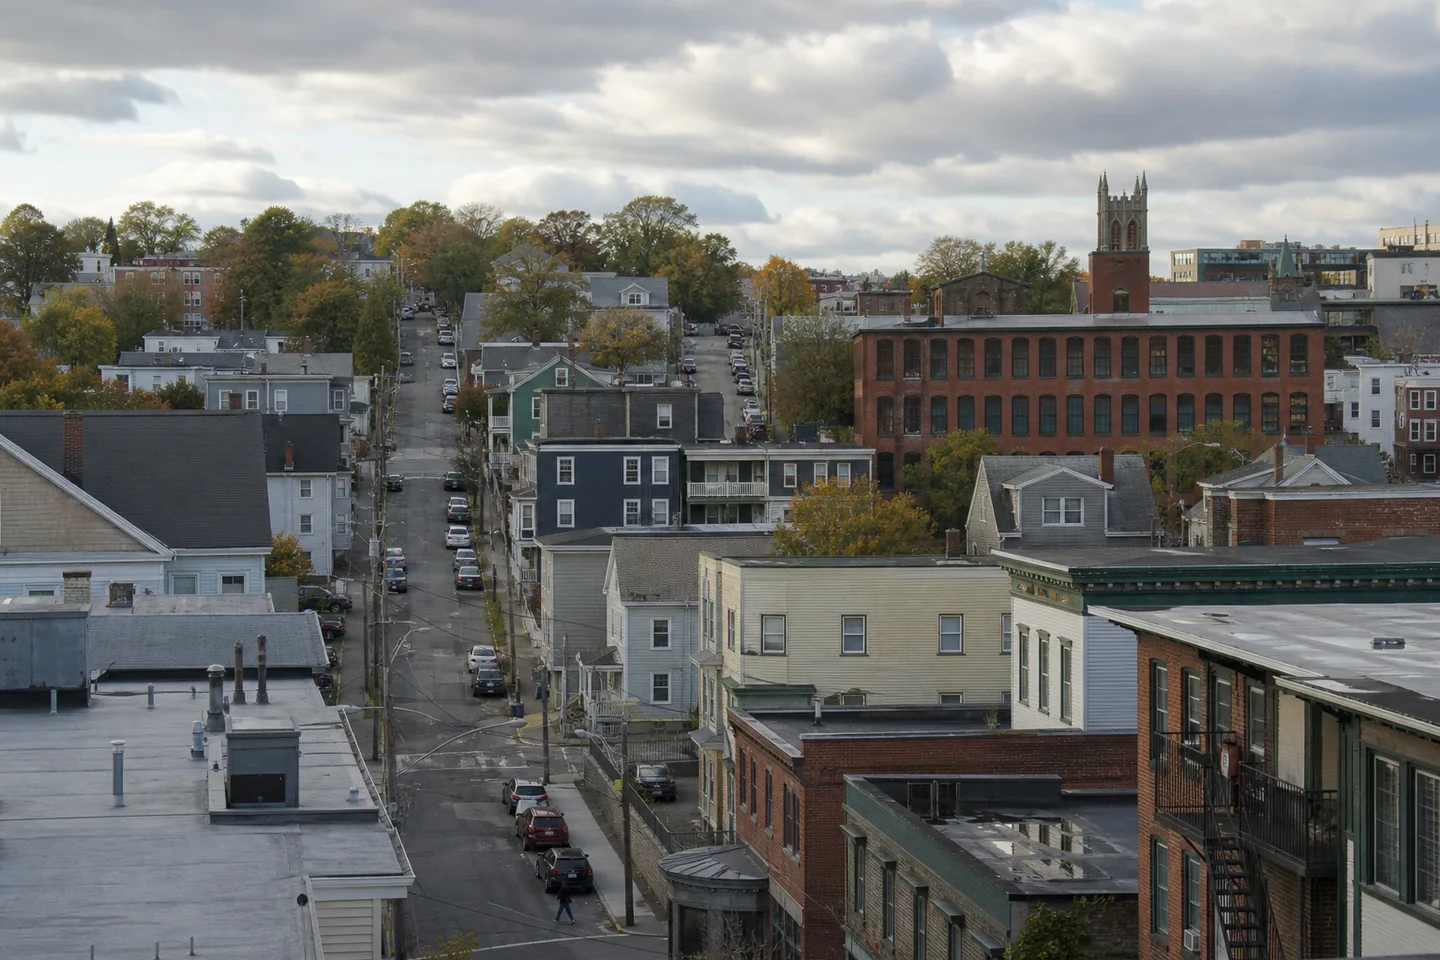
Moving from Boston to Worcester presents a lower housing-cost profile alongside a lower income base and mixed demand signals. IRS SOI migration for 2022–2023 measured 7,548 tax-return households moving along this corridor. Those returns represented 48.38% of Worcester’s inbound returns. IRS flow means tax-return households. It does not identify renters, every mover or future demand, so the count describes past filer movement rather than a rental-demand forecast.
For household housing costs, Zillow’s June 30, 2026 asking-rent observation was $3,210 in Boston and $2,170 in Worcester. The metro Zillow home-value benchmark on the same date was $746,595 in Boston and $487,476 in Worcester. The destination therefore carries lower market-level rent and home-value benchmarks, but neither figure establishes the cost of a particular lease or purchase. Taxes, utilities, transportation, building condition and unit size remain outside those comparisons.
The underwriting trade-off is less one-sided. ACS 2024 five-year median household income was $95,939 in Worcester versus $115,863 in Boston. BLS CES payrolls over the 12 months to June 2026 changed by negative 0.03% in Worcester and negative 0.8% in Boston. Worcester shows the smaller contraction, not expansion, and payroll change does not establish property vacancy or collections. The next underwriting question is whether a specific Worcester rent roll, tenant-income profile and expense history justify the quoted price after taxes, insurance, repairs, concessions and vacancy are included.