
Moving corridor · West origin

Moving from Salt Lake City to Ogden

A directional rental-market brief grounded in a measured IRS flow, then tested against housing costs, income, employment, regional prices and climate exposure.

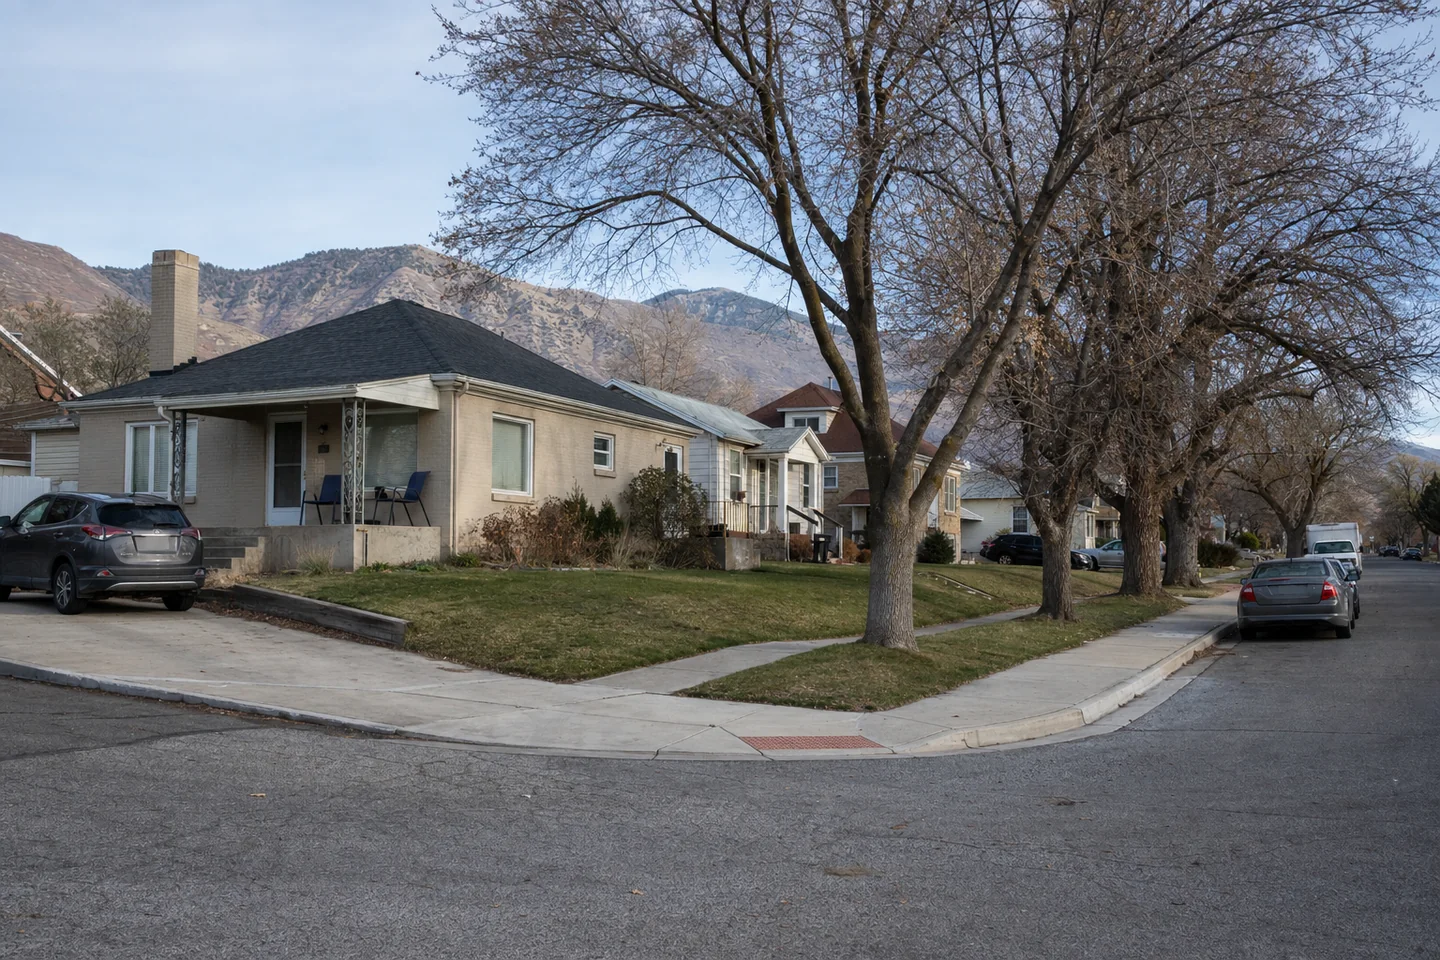
Salt Lake City, UT cityscapeFrom · Salt Lake City
Ogden, UT cityscapeTo · Ogden
Direct flow4,217tax-return households
People proxy7,395IRS exemptions
AGI per return$65,354within this corridor
Monthly rent change−$24destination minus origin
Direct answer

What materially changes on this move

Market-area evidence narrows the questions. It does not replace a neighborhood check, a lease comp or property-level underwriting.

The measured IRS flow comes first: SOI migration 2022-2023 recorded 4,217 tax-return households moving from the Salt Lake City area to the Ogden area, carrying 7,395 exemptions as a people proxy. Those returns represented 13.84% of Salt Lake City’s recorded outbound returns and 28.96% of Ogden’s recorded inbound returns. The IRS flow measures tax-return households. It does not identify renters, every mover or future demand, so it benchmarks this corridor without establishing a rental-demand trend.

At the destination, the household housing-cost contrast is narrow for rent but wider for the home-value screen. Zillow observations dated 2026-06-30 placed Ogden asking rent at $1,614 and Salt Lake City at $1,638. Ogden’s $519,707 figure also sat below Salt Lake City’s $567,346 figure; each is a metro Zillow home-value benchmark, not a property transaction price. The FY2026 HUD Fair Market Rent standard runs in the opposite direction, with Ogden higher. For rental-property underwriting, Ogden shows a higher gross-yield screen, but that remains a pre-expense market benchmark rather than a net-return measure.

The operating context is less one-sided. BLS CES payroll employment for the year ending 2026-06 was up 1.27% in Salt Lake City and down 0.92% in Ogden. FEMA’s National Risk Index counties release via ArcGIS reports a modeled climate/hazard loss ratio of 0.1436% for Ogden versus 0.1814% for Salt Lake City, with earthquake the top hazard in both. Payroll change does not establish property vacancy or collections, and FEMA’s ratio is not an insurance quote. The next underwriting question is property-specific: at documented achievable rent, do the unit’s taxes, insurance terms, maintenance, capital work, vacancy allowance and financing terms meet the household’s or investor’s chosen cash-flow threshold?

Measured direction

The route exists in the IRS records

One inflow-side county pair enters once. Same-market moves are excluded before market aggregation.

Direct IRS relocation flow from Salt Lake City to OgdenORIGIN MARKET AREASalt Lake CityUTAll-US outbound households30,473DESTINATION MARKET AREAOgdenUTAll-US inbound households14,559DIRECT CORRIDOR4,217tax-return households7,395 people proxy · $65,354 AGI / returnDirection and totals come from the same IRS inflow-side county-pair records.
IRS SOI — county migration and mover income · SOI migration 2022-2023. Tax-return households are not the same as renters or every mover.
Before and after

The move changes more than rent

Every row retains its own definition and scale. The chart does not blend these measures into a relocation score.

What changes between the origin and destinationSalt Lake CityOgdenMonthly asking renteach row uses its own source-unit scale$1,638$1,614Home valueeach row uses its own source-unit scale$567,346$519,707Household incomeeach row uses its own source-unit scale$98,083$101,203Gross rental yieldeach row uses its own source-unit scale3.5%3.7%Regional price leveleach row uses its own source-unit scale100.9100.3Annual climate losseach row uses its own source-unit scale0.181%0.144%Dots show source values, not a blended relocation score.
Direct source values; destination is emerald and origin is ink. “n/a” remains unavailable rather than estimated.
EvidenceSalt Lake City, UTOgden, UTDestination change
Median asking rent2026-06-30$1,638$1,614−$24
Median home value2026-06-30$567,346$519,707−$47,639
Median household incomeCensus ACS$98,083$101,203+$3,120
Gross rental yieldrent × 12 ÷ home value3.5%3.7%+0.3%
Annual employment changeCES / CES+1.3%−0.9%−2.2%
Regional price level2024; US = 100100.9100.3−0.5
Expected annual building lossFEMA NRI market aggregate0.181%0.144%−0.038%
Net IRS migrationall-US tax-return households−2,144+930+3,074
Directional analysis

Three decisions hidden inside one move

The sections follow the evidence that is material for this corridor, not a universal city template.

01
Housing cost transition

Lower Zillow benchmarks, but not every housing standard

At the 2026-06-30 Zillow observation date, Ogden’s monthly asking rent was $1,614 versus $1,638 in Salt Lake City. That is a modest destination-side difference in the metro rent benchmark, not a quote for a particular floor plan, neighborhood or lease. A material counterpoint appears in HUD’s FY2026 Fair Market Rent: the two-bedroom standard was $1,614 in Ogden and $1,494 in Salt Lake City. Fair Market Rent is a HUD standard rather than a Zillow market-rent observation. A relocating household therefore needs unit-level asking rents, concessions, utilities and commuting costs before treating Ogden as categorically cheaper.

Using the 2026-06-30 Zillow observations against ACS 2024 five-year household income, the cross-release price-to-income screen was 5.14 in Ogden and 5.78 in Salt Lake City; the corresponding rent-to-income screens were 19.14% and 20.04%. These are directional comparisons across different releases, not synchronized measures of a current household’s budget share or mortgage qualification. Ogden’s metro Zillow home-value benchmark sits below Salt Lake City’s, while the gross-yield screens were 3.73% and 3.46%, respectively. Gross yield precedes operating expenses, financing, downtime and capital work. The next check is whether target-unit rent evidence and a complete expense file preserve that directional advantage.

02
Market and risk context

A softer resale screen meets contrary home-value growth

Redfin’s metro tracker through 2026-05-01 recorded 3.6 months of supply in Ogden versus 3.0 in Salt Lake City, while price drops covered 34.68% of Ogden listings and 32.6% of Salt Lake City listings. Taken alone, those measures form a softer resale screen for Ogden. They are not evidence of rental vacancy and do not establish future sale prices. Separately, Zillow observations dated 2026-06-30 reported year-over-year growth in its metro home-value benchmark of 2.12% for Ogden and 1.32% for Salt Lake City. That separate, later Zillow observation complicates a one-directional reading of the earlier Redfin measures; the two source periods should remain distinct.

FEMA’s National Risk Index counties release reports a modeled climate/hazard loss ratio of 0.1436% for Ogden and 0.1814% for Salt Lake City. Earthquake is the identified top hazard in both markets. The lower Ogden ratio is not a property risk assessment, premium indication or claim estimate. HMDA 2024 purchase originations place the investor share at 3.83% in Ogden versus 4.86% in Salt Lake City. That is a descriptive occupancy screen, not proof of buyer competition. The next risk question belongs at the address level: what do current insurance quotes, deductibles, earthquake terms, inspection findings, retrofit history and exit assumptions show for the target property?

03
Income and employment

Weaker payroll movement, higher measured household income

BLS CES data for the year ending 2026-06 show Salt Lake City payroll employment up 1.27% and Ogden down 0.92%. This is the clearest labor-market contrast in the corridor, but it does not establish rent collections, apartment vacancy or the employment status of a prospective tenant. The ACS 2024 five-year release provides a material counter-signal: median household income was $101,203 in Ogden and $98,083 in Salt Lake City. ACS household income and CES payroll change describe different populations and periods. Underwriting should therefore separate the recent payroll direction from the income profile observed in the household survey.

IRS SOI migration 2022-2023 placed corridor mover AGI at $65,354.28 per tax return. That figure is adjusted gross income for tax-return households, not wages, renter income or a qualification standard. BEA’s 2024 Regional Price Parities provide another distinct screen: Ogden’s all-items index was 100.349 versus Salt Lake City’s 100.868, while the housing indices were 117.903 and 123.311. Ogden is lower on both measured price-level comparisons, although both housing readings stand above the national level. The next labor-income diligence question is whether current applicant files, major-employer concentration, rent-roll history, renewals and delinquency records match the property’s proposed rent and expense assumptions.

Counter-signals

What the easy reading misses

A lower rent, stronger job figure or larger flow can still hide a different risk elsewhere in the record.

01

Ogden’s lower Zillow asking rent is not a universal affordability result. At the 2026-06-30 Zillow date, the destination benchmark was $1,614 versus $1,638, yet the FY2026 HUD two-bedroom Fair Market Rent was $1,614 in Ogden and $1,494 in Salt Lake City. The HUD standard and Zillow observation answer different questions.

02

Ogden’s negative CES payroll change invites a weaker-income reading, but the ACS 2024 five-year median household income was $101,203 in Ogden versus $98,083 in Salt Lake City. The sources cover different concepts and periods, so neither observation alone establishes current tenant qualification, collections or household financial resilience.

03

Redfin’s through-2026-05-01 supply and price-cut measures present a softer Ogden resale screen, but Zillow’s separate 2026-06-30 observation reported 2.12% year-over-year home-value growth in Ogden versus 1.32% in Salt Lake City. The later Zillow benchmark is material contrary evidence and should not be blended into Redfin’s earlier observation period.

Reading boundary

What this corridor cannot establish

IRS migration data count tax-return households, with exemptions serving only as a people proxy. They exclude some nonfilers and do not identify renters, every mover, reasons for moving or future demand. The Salt Lake City-to-Ogden count is therefore evidence of recorded tax-return movement during SOI migration 2022-2023, not a forecast of leasing activity.

Metro-level rent, home-value, income, employment, hazard and resale benchmarks cannot establish a specific property’s condition, achievable rent, tenant quality, vacancy history, taxes, insurance quote, earthquake coverage, capital needs or financing terms. They also do not resolve a household’s utilities, commuting costs, debts, unit requirements or neighborhood-level trade-offs.

Source ledger

Separate releases, one traceable brief

Pull dates show when RentMarker retrieved each release, not when every upstream measure changed.

SourceRole hereReleaseRetrieved
IRS SOI — county migration and mover incomeDirectional tax-return household flow and mover AGISOI migration 2022-20232026-07-26
Zillow ZHVI — metro home valuesMarket-area home values and annual changeMetro_zhvi_uc_sfrcondo_tier_0.33_0.67_sm_sa_month.csv2026-07-26
Zillow ZORI — metro market rentsMarket-area asking rents and annual changeMetro_zori_uc_sfrcondomfr_sm_sa_month.csv2026-07-26
Census ACS 5-year — household incomeMedian household income and affordability ratiosACS 2024 5-year2026-08-02
Census ACS 5-year — populationMarket-area population contextACS 2024 5-year2026-07-26
HUD Fair Market Rents — Section 8 standardHUD two-bedroom Fair Market Rent standardFY2026 FMR2026-07-26
BLS CES — payroll employmentPayroll employment change where publishedCES SM current2026-07-26
BLS LAUS — resident employmentResident employment change where CES is unavailableLAUS current2026-07-26
BEA Regional Price Parities — metropolitan price levelsRegional price levels for directly matched metropolitan areas2024 Regional Price Parities (released 2026-02-19); history 2008-20242026-08-03
FEMA National Risk Index — hazard loss ratiosExpected annual building-loss exposureNRI counties (FEMA ArcGIS)2026-07-26
Redfin Data Center — inventory, days on market, and price cutsFor-sale inventory and marketing conditionsmetro tracker through 2026-05-012026-07-26
Census Building Permits Survey — permitted unitsPermitted housing supplyBPS through 20262026-07-26
HMDA / CFPB — purchases by occupancy typeInvestor purchase-mortgage shareHMDA 2024 purchase originations2026-07-26