States / Wyoming
State rental intelligence

Wyoming rental market data

A source-traced view across 7 metro markets and 23 counties. State figures below are labelled medians and totals—not a made-up statewide investment score.

7/7 metros scored23/23 counties with FEMA risk14 sources used in this analysis
Median scored metro43.0out of 100 · 7 measured metros
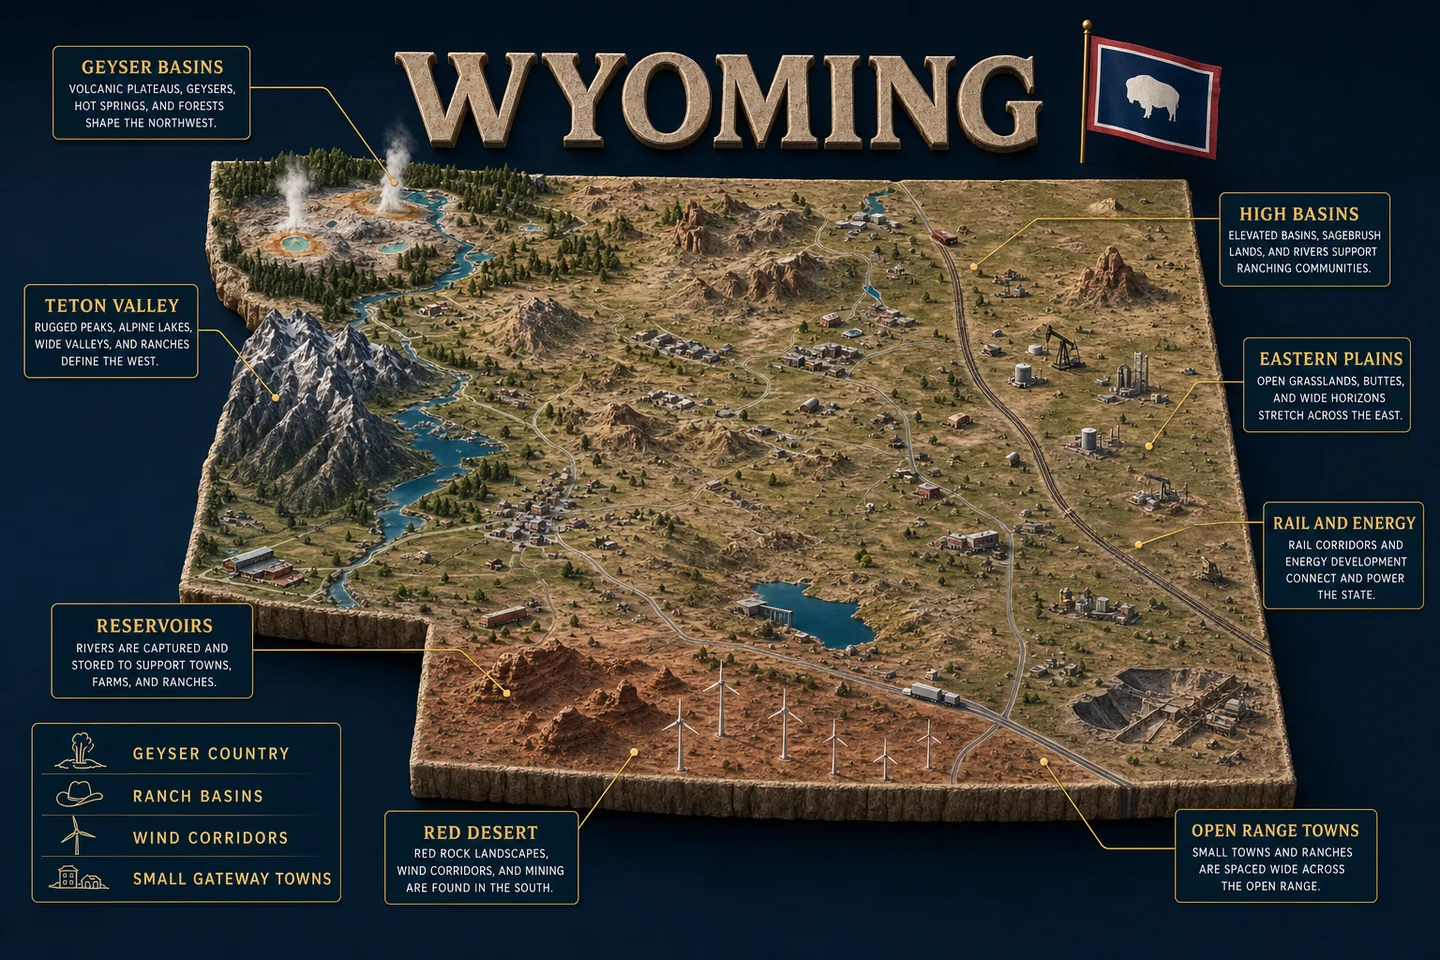
Wyoming identity diorama showing regional landscape, cities, housing, and infrastructure
Median metro home value$339kmedian across published metro values
Median metro rent$1,258monthly · published metro values
Median gross yield4.2%annual rent ÷ price · before costs
Median job trend▼ 1.0%trailing 12-month metro employment
State research brief

Median rent growth is outpacing median home-value growth across Wyoming's seven measured metros even though the 90th-percentile employment reading is still negative, making rent durability the central screen.

Updated 2026-07-31 · evidence current to the releases listed below.

Across seven measured metros, median asking-rent growth was 2.7% year over year versus 0.6% for home values, a supplied difference of 2.1 percentage points. That rent signal conflicts with a median employment decline of 1.0%; even the 90th-percentile employment reading was down 0.2%. Migration provides a modest counter-signal: the 23 counties recorded 227 more inbound than outbound movers, or 0.4 per 1,000 residents, and aggregate mover income had a positive $224,721 gap.

The combination supports screening for properties whose rents work without relying on continued appreciation, but it does not establish broad rental strength. The seven-metro median was 2.5 months of supply, yet the 90th percentile reached 10.9 months, and named markets ranged from fast turnover to substantial resale drag. County rental coverage is also incomplete: rents are measured in 12 of 23 counties and rent growth in only 6. These figures are distributions across measured areas, not a statewide property profile.

01

Median metro rent growth of 2.7% versus 0.6% home-value growth → verify achievable rents and lease renewal depth rather than relying on appreciation.

02

Median employment growth of -1.0% with 90th-percentile growth still at -0.2% → require submarket-specific evidence that tenant demand can withstand labor weakness.

03

Median supply of 2.5 months versus a 90th-percentile reading of 10.9 months → set resale timelines and discounts by metro, not from the measured median.

04

Median metro gross yield of 4.2%, with Casper, WY at 5.2% among displayed candidates → stress operating costs because modest gross-yield differences can disappear after expenses.

05

Median county vacancy of 13.3% alongside 41.5% rent burden → distinguish unavailable or non-long-term vacant stock from units competing for tenants.

01
Price and rent momentum

Rent growth leads, but the price-rent split changes by metro

Median asking rent increased 2.7% across the seven measured metros while median home value increased 0.6%. The supplied gap was 2.1 percentage points. Results were not uniform: the 10th-to-90th-percentile range was -1.0% to 5.5% for rents and -1.7% to 2.4% for values.

Jackson, WY had 8.0% rent growth against 1.6% value growth, but its measured gross yield was only 3.0% on a $1,407,000 value and $3,475 monthly rent. Cheyenne, WY was more balanced at 3.9% rent growth and 3.6% value growth. Gillette, WY showed the sharpest divergence: rent rose 2.9% while value fell 4.0%. Screening therefore needs both a rent-growth test and an entry-price test; rent momentum alone does not identify the stronger income return.

Evidence: Zillow ZHVI — metro home values · Zillow ZORI — metro market rents

02
Employment and household movement

Labor contraction outweighs a slight migration counter-signal

Employment growth had a median of -1.0% across seven metros, with a 10th-to-90th-percentile range of -2.3% to -0.2%. The highlighted readings were also negative: Cheyenne, WY was down 0.1%, Jackson, WY 0.3% and Laramie, WY 0.5%. That weakens the case for treating recent rent gains as proof of expanding job-based demand.

Migration was slightly positive across all 23 counties with data: 17,179 movers entered and 16,952 left, producing net migration of 227, or 0.4 per 1,000 residents. Aggregate inbound mover income exceeded outbound income by $224,721. This is a genuine counter-signal, but its small scale and different measurement period cannot establish current rental-household formation in any particular metro.

Evidence: Census ACS 5-year — population · BLS CES — payroll employment · BLS LAUS — resident employment · IRS SOI — county migration and mover income

03
Supply and resale conditions

Compact median inventory conceals severe resale drag

The seven-metro median was 2.5 months of supply and 49 days on market, but the 90th-percentile readings reached 10.9 months and 113.2 days. Gillette, WY was more strained than that distribution suggests, with 16.4 months of supply, 136 days on market, price cuts on 25.2% of listings and a 92.3% sale-to-list ratio. Jackson, WY also had 7.2 months of supply and 98 days on market.

The counter-signal is faster turnover elsewhere. Cheyenne, WY had 1.8 months of supply and 23 days on market alongside 486 permitted units; Laramie, WY had 2.4 months and 18 days alongside 86 permits. Permits are not completed rental units, however, and sale-to-list coverage exists for only five metros. Exit assumptions should therefore use the exact market's inventory and transaction evidence rather than the seven-metro median.

Evidence: Census Building Permits Survey — permitted units · Redfin Data Center — inventory, days on market, and price cuts

04
Entry cost and affordability

Lower entry costs produce the better gross-yield screens

Across seven metros, the median measured value was $339,090, median monthly rent was $1,258 and median gross yield was 4.2%. The gross-yield 10th-to-90th-percentile range was narrow at 3.5% to 4.8%, but named markets still separated. Casper, WY showed a 5.2% gross yield on a $316,364 value and $1,361 rent, compared with 4.5% in both Cheyenne, WY and Gillette, WY.

Gillette, WY had the lowest displayed price-to-income ratio at 3.77, followed by Rock Springs, WY at 3.95 and Casper, WY at 4.38. Across the seven metros, market rent had a median ratio of 125.8% of the two-bedroom HUD fair-market-rent standard, with a 10th-to-90th-percentile range of 112.5% to 169.5%. That comparison flags potential affordability or subsidy constraints, but it does not match specific units by bedroom count. Gross yield also excludes vacancy, operating costs, financing and capital work.

Evidence: Census ACS 5-year — household income · HUD Fair Market Rents — Section 8 standard · Zillow ZHVI — metro home values · Zillow ZORI — metro market rents

05
County market dispersion

Long-run appreciation does not guarantee current yield

Among 21 counties with FHFA data, median appreciation was 4.0% over one year and 47.4% over five years. Big Horn County recorded 8.5% annual and 71.0% five-year appreciation. Lincoln County combined 7.4% annual appreciation and 66.8% over five years with a 5.8% gross yield. Sublette County had a similar 65.6% five-year gain but only a 3.0% gross yield. Past appreciation and present income return therefore need separate screens.

County listing data also require volume context. Niobrara County had 97 days on market but only 8 active listings. Johnson County had 81 days, 76 active listings and a 2.6% pending ratio. Teton County had 77 days, 229 active listings and only 4.7% of listings price-reduced. Days on market alone cannot establish equivalent exit liquidity, and county rent coverage is limited to 12 counties, with year-over-year rent data in 6.

Evidence: FHFA House Price Index — annual county appreciation · Realtor.com Economic Research — county listing inventory · Zillow ZHVI and ZORI — county values and rents

06
Housing stock and tenant conditions

High reported vacancy coexists with substantial renter burden

Across 23 counties, the median ACS vacancy rate was 13.3%, while the 90th percentile reached 24.8%. At the same time, the median share of renters spending at least 30% of income on rent was 41.5%. Albany County combined a 9.4% vacancy rate with a 50.0% renter share and 51.1% rent burden. Campbell County's rent-burden measure was also 49.9%.

Housing type helps explain why aggregate vacancy cannot be read as available rental supply. The median county housing stock was 74.3% single-family and only 2.4% large multifamily. Sublette County reported 30.1% vacancy, but just 16.4% renter share and 84.7% single-family stock; Teton County reported 28.0% vacancy and 41.7% renter share. ACS vacancy includes housing that may not be offered as long-term rentals, so property-level availability and lease competition remain unmeasured.

Evidence: Census ACS 5-year — county housing value, tenure and stock

Evidence selected for Wyoming

The ranges behind the analysis

Each row keeps its own unit and shows the measured 10th percentile, median and 90th percentile. A single-value row is labelled directly.

Price and rent momentumAre home values and asking rents moving together or separating?
10th pct.median90th pct.Home-value change-1.7%0.6%2.4%Asking-rent change-1.0%2.7%5.5%Rent minus price2.1%
Employment and household movementDo jobs, household movement and mover income point in the same direction?
10th pct.median90th pct.Job change-2.3%-1.0%-0.2%Net migration / 1k0.4Net household movement227
Supply and resale conditionsWhat do permits, inventory, marketing time and price cuts say about pressure?
10th pct.median90th pct.Permits / 1k0.51.77.3Months of supply1.9×2.5×10.9×Days on market21 days49 days113 daysListings with cuts17.6%22.7%27.1%
Shape of the state

Distribution before conclusion

A statewide median can hide a wide spread. These SVG charts render at build time and carry no chart library or browser-side data request.

Metro score distribution7 scored metros · median 43.0
00–19120–39540–59160–79080–100
County evidence coverageEvery gap stays visible as missing—not estimated
52%12/23Rent100%23/23Climate100%23/23Migration
Highest measured metro gross yieldsscreening metric only · before expenses and financing
Casper5.2%Cheyenne4.5%Gillette4.5%Rock Springs4.2%Riverton4.1%Laramie3.8%Jackson3.0%
Metro leaderboard

Markets touching Wyoming

Multi-state CBSAs appear in every member state. Score is still a metro score; no value is reweighted into a statewide ranking.

#MetroScorePriceRentYieldJobs
1Cheyenne, WY60$393k$1,4904.5%▼ 0.1%
2Laramie, WY52$380k$1,2143.8%▼ 0.5%
3Rock Springs, WY45$296k$1,0444.2%▼ 2.3%
4Gillette, WY43$339k$1,2584.5%▼ 1.4%
5Jackson, WY43$1407k$3,4753.0%▼ 0.3%
6Riverton, WY40$331k$1,1334.1%▼ 2.2%
7Casper, WY37$316k$1,3615.2%▼ 1.0%
Below the metro line

Largest counties in Wyoming

County figures join on the five-digit FIPS code. The table uses measured local values and prints “n/a” wherever a publisher has no record.

CountyPopulationPriceRentYieldHazard
Laramie County, WY101,060$393k$1,4904.5%inland flooding
Natrona County, WY79,977$316k$1,3615.2%inland flooding
Campbell County, WY47,240$338k$1,2584.5%inland flooding
Sweetwater County, WY41,542$296k$1,0444.2%inland flooding
Fremont County, WY39,533$331k$1,1334.1%inland flooding
Albany County, WY38,249$380k$1,2143.8%inland flooding
Sheridan County, WY32,055$447kn/an/ainland flooding
Park County, WY30,449$458k$1,3523.5%inland flooding
Teton County, WY23,396$2205k$4,4582.4%inland flooding
Uinta County, WY20,644$338kn/an/ainland flooding
Lincoln County, WY20,486$507k$2,4505.8%inland flooding
Carbon County, WY14,463$216k$1,0255.7%inland flooding
County yield sample12/23counties have the rent needed to compute yield
Statewide net migration+227IRS tax-return households summed across counties
Median investor share6.7%among counties with HMDA purchase records
Sources used in this analysis

Measured releases, not a global source count

Only sources supporting the selected evidence modules are listed here.

Bear case

What can break the thesis

  1. Recent rent growth may not persist if measured employment contraction weakens household demand.
  2. The positive migration balance is only 227 people and comes from a different measurement period than the market and employment indicators.
  3. County rent levels cover 12 of 23 counties and county rent growth covers only 6, leaving substantial geographic gaps.
  4. Gross yields omit vacancy, maintenance, management, insurance, financing, taxes and capital expenditures.
  5. ACS vacancy is not a count of market-ready long-term rentals, while source dates, geographic definitions and property mixes differ across the packet.
Investor questions

Before underwriting a property

Are rents clearly outperforming home values?

At the median across seven measured metros, yes: rent growth was 2.7% and home-value growth was 0.6%, a 2.1 percentage-point gap. The ranges include both declines and gains, so the result does not apply uniformly to every metro.

Does measured demand support continued rent growth?

The labor evidence does not: median metro employment fell 1.0%, and the 90th-percentile reading was still down 0.2%. Net migration of 227 and a positive aggregate mover-income gap are counter-signals, but they are too limited to establish metro-level rental demand.

Where is resale risk most visible among the named metros?

Gillette, WY has the clearest measured warning: 16.4 months of supply, 136 days on market, a 25.2% price-drop share and a 92.3% sale-to-list ratio.

Which displayed entry market has the strongest gross-yield screen?

Casper, WY at 5.2%, compared with 4.5% for Cheyenne, WY and 4.5% for Gillette, WY. These are gross calculations, not expected net returns.

Do high county vacancy rates mean ample rental availability?

No. The vacancy measure covers all vacant housing, and the stock is predominantly single-family. It does not identify which units are habitable, offered for long-term rent or comparable with a target property.