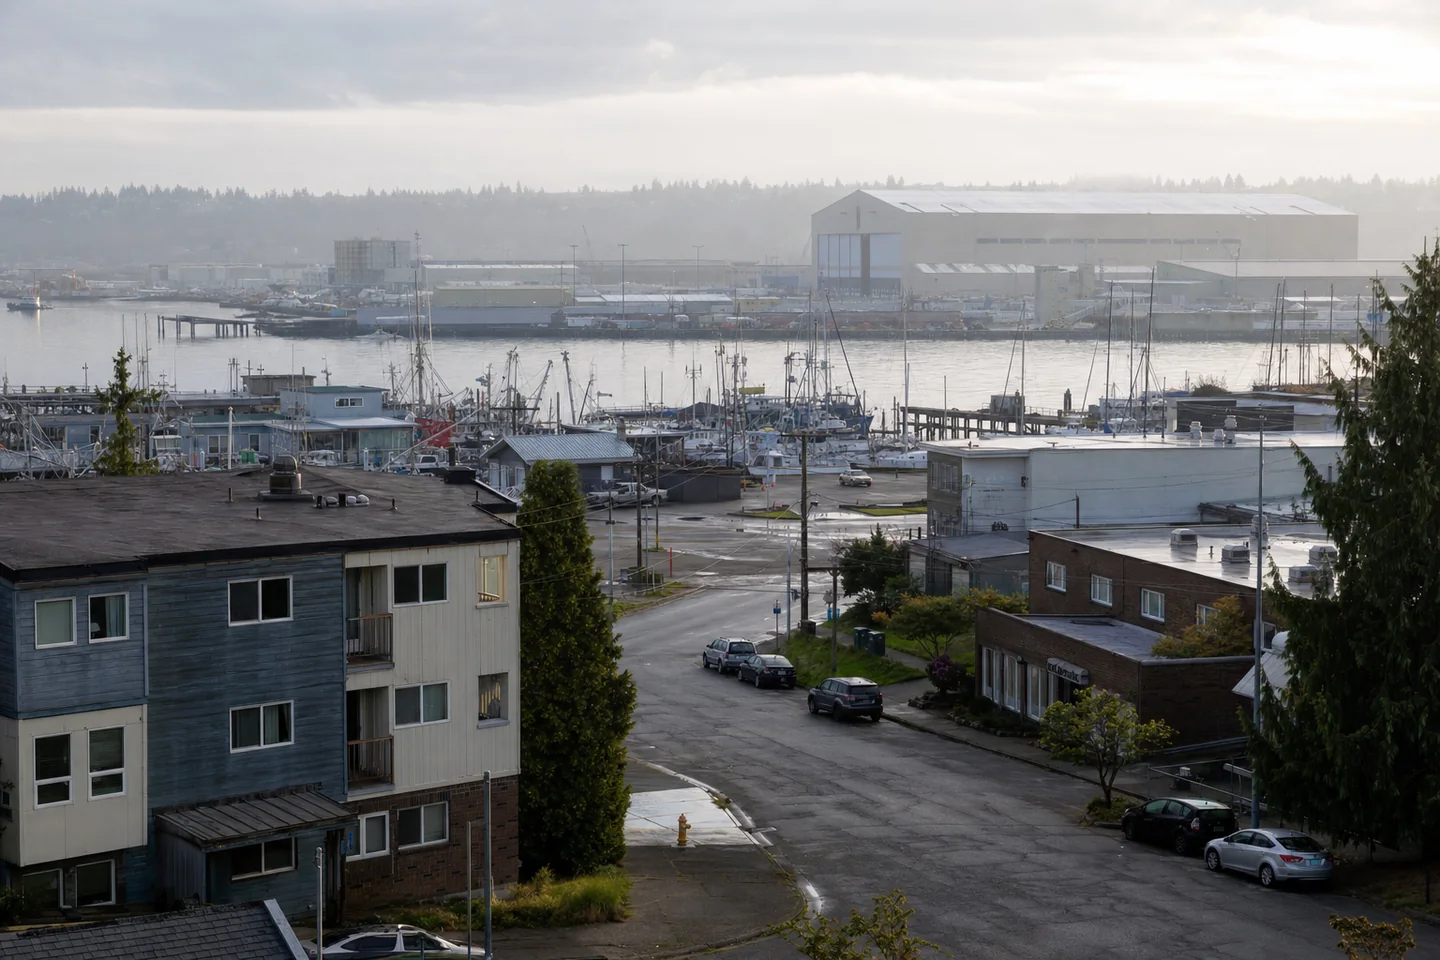
Everett’s Zillow ZHVI typical home value is $654,227, while ZORI typical observed market rent is $1,946 a month. That produces a 3.57% gross yield before every operating cost, financing, vacancy, maintenance and taxes. ZHVI fell 1.48% year over year while ZORI rose 1.61%, a recent divergence rather than a forecast. The Zillow value is 7.83x ACS median household income, and annual ZORI equals 27.97% of that income; these citywide affordability comparisons do not represent a specific buyer’s payment or tenant’s budget.
Everett renters hold 51.05% of occupied units, and the citywide vacancy rate is 6.38%. Single-family housing accounts for 50.16% of all units and large multifamily for 18.95%, indicating a mixed stock without identifying purchasable inventory. ACS reports a $565,300 median value among surveyed owner-occupied housing and $1,740 median gross rent, including selected utilities, among surveyed renter-occupied housing. Those ACS measures differ in concept and period from Zillow’s typical city value and observed market rent and should not be averaged.
Among Everett renter households measured by ACS, 55.30% are rent burdened at or above the stated threshold. Of vacant units, 41.68% are classified as for rent; that is a vacancy-reason share, not available investment inventory. Population increased 1.89% between overlapping ACS five-year vintages, a comparison that is not annualized and may reflect boundary changes. Median household income is $83,512, while poverty is 12.92% and unemployment is 5.83%. Together these describe citywide demand constraints and depth, but cannot establish tenant quality, achievable property rent or lease-up speed.
For Snohomish County, county context shows a 0.77% property-tax rate and 22.14% price-reduced listings; neither measures Everett. The Seattle metro recorded -0.05% job growth and 5.35 permits per 1,000 residents; these metro indicators provide broader labor and supply context, not city outcomes. The national 30-year mortgage rate was 6.58%, so national financing context can materially alter leveraged cash flow without changing the unlevered city gross yield.
Underwriting remains limited by citywide typicals and survey aggregates: neither gives a property’s condition, unit mix, concessions, utility allocation, insurance, taxes, management, maintenance, capital needs or regulatory exposure. Next, obtain an address-level rent roll and lease comparables; inspect the building; verify title, zoning and permitted use; price insurance and county tax bills; and model vacancy, turnover, repairs, reserves and financing. Recalculate net operating income and cash flow rather than treating gross yield or broad vacancy as a return or leasing promise.