States / North Dakota
State rental intelligence

North Dakota rental market data

A source-traced view across 8 metro markets and 53 counties. State figures below are labelled medians and totals—not a made-up statewide investment score.

8/8 metros scored53/53 counties with FEMA risk13 sources used in this analysis
Median scored metro64.5out of 100 · 8 measured metros
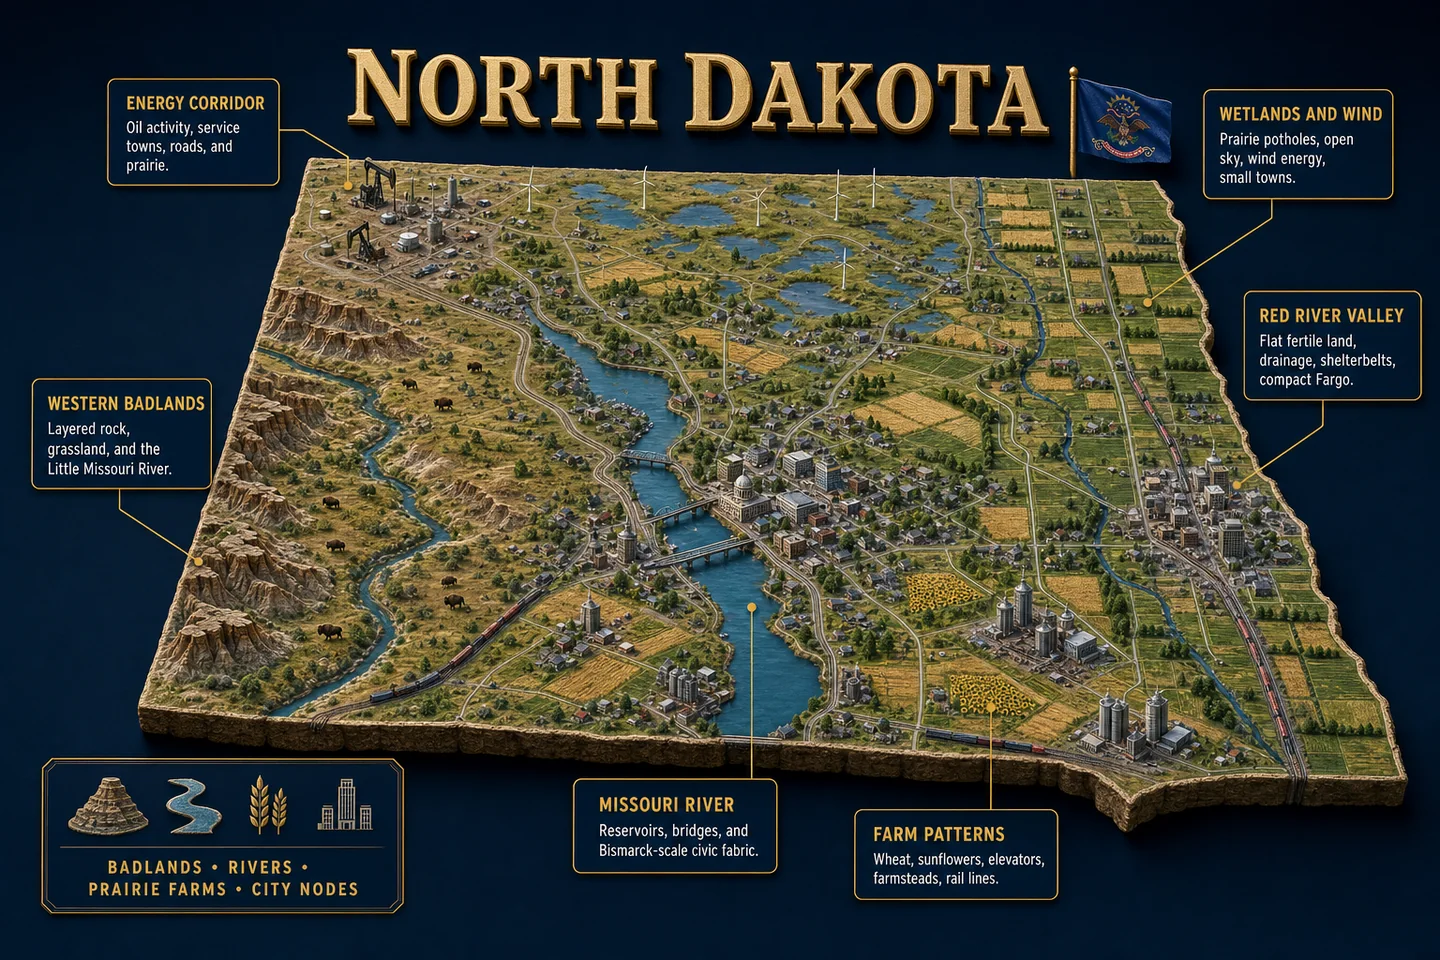
North Dakota identity diorama showing regional landscape, cities, housing, and infrastructure
Median metro home value$305kmedian across published metro values
Median metro rent$1,147monthly · published metro values
Median gross yield4.8%annual rent ÷ price · before costs
Median job trend▲ 0.3%trailing 12-month metro employment
State research brief

Home values are rising 1.5 percentage points faster than rents at the median of eight measured metros, while nearly flat migration and outbound mover income leave demand support unconfirmed.

Updated 2026-07-31 · evidence current to the releases listed below.

Across North Dakota's eight measured metros, the median annual home-value increase was 5.6%, compared with 4.1% for asking rents. That separation can narrow entry yield unless a buyer finds a local reversal: rents rose faster than values in both Grand Forks and Minot. Employment provides a modest counter-signal, but median job growth was only 0.3%, net migration across 47 measured counties was 100 people, and aggregate outbound mover income exceeded inbound mover income by $331,603.

The evidence supports locality-level screening rather than a statewide conclusion. Resale conditions range from relatively quick marketing in Bismarck to 79 days and 4.8 months of supply in Wahpeton, while county housing data combine high total vacancy with substantial renter burden in several small counties. Coverage is also uneven: current county rents cover 11 of 53 counties, county listing measures cover 21, and metro resale measures cover six markets. The packet cannot establish property-level rent, occupancy, operating costs, condition, insurance pricing or hazard exposure.

01

Metro home values rose 5.6% at the median versus 4.1% for rents → screen acquisitions without assuming rent growth will match recent value growth.

02

Grand Forks and Minot rent growth exceeded value growth → compare local momentum rather than applying the statewide metro median to every market.

03

Median job growth was 0.3%, but net migration was only 0.1 per 1,000 and mover income had a $331,603 outbound gap → require local evidence of the tenant base behind projected occupancy.

04

Six measured metros had median resale time of 37.5 days and 24.0% price reductions, with slower conditions in Wahpeton and Dickinson → use metro-specific exit timing and sale-price sensitivity.

05

County median total vacancy was 20.2% while median renter burden was 35.0% → distinguish genuinely rentable vacancies from unavailable or unsuitable stock and test tenant rent headroom.

01
Price and rent momentum

Values lead rents overall, but Grand Forks and Minot reverse the pattern

The median home-value increase across eight measured metros was 5.6%, versus 4.1% for asking rents. The supplied difference shows rent growth trailing value growth by 1.5 percentage points. For screening, that means recent statewide metro momentum does not support assuming rents will rise as quickly as acquisition values.

The aggregate pattern has meaningful local exceptions. Grand Forks rents increased 7.9% while values rose 7.3%, a calculated rent advantage of 0.6 percentage points. In Minot, rents rose 6.5% against 3.7% value growth, a calculated 2.8-point advantage. These reversals make metro-level rent verification more useful than applying the median relationship to every deal.

Evidence: Zillow ZHVI — metro home values · Zillow ZORI — metro market rents

02
Employment and household movement

Small job gains are not confirmed by household or income movement

Job growth across eight measured metros had a 0.3% median, with the 10th-to-90th-percentile range running from a 1.1% decline to a 1.5% increase. Dickinson recorded 1.6% growth, Jamestown 1.5% and Bismarck 0.3%, providing a positive but uneven employment signal.

Household movement does not reinforce that signal. Across 47 counties with migration data, net migration totaled 100 people, or 0.1 per 1,000 residents. Aggregate outbound mover income exceeded inbound mover income by $331,603. The combination supports checking local employers and tenant sources, but it cannot establish household formation, renter demand or the direction of a particular submarket because the employment and migration measures cover different periods and geographies.

Evidence: Census ACS 5-year — population · BLS CES — payroll employment · BLS LAUS — resident employment · IRS SOI — county migration and mover income

03
Supply and resale conditions

Active permitting coexists with slow and price-sensitive resale markets

Across eight measured metros, the median permit count was 112, or 2.2 permitted units per 1,000 residents. Fargo recorded 1,118 permits and 4.3 per 1,000, Grand Forks had 314 and 3.0 per 1,000, and Bismarck had 366 and 2.7 per 1,000. Permits identify authorized units, not completed housing or rental tenure, so they do not by themselves establish future rental competition.

Resale data for six measured metros show a median of 37.5 days on market, 2.8 months of supply and price reductions on 24.0% of listings. Wahpeton was materially slower at 79 days and 4.8 months of supply, with a 96.6% sale-to-list ratio. Dickinson took 71 days with 3.4 months of supply. Bismarck is a counterpoint at 30 days and 2.4 months, although 26.1% of listings had price cuts. Exit assumptions therefore need to reflect the specific metro rather than the permit totals alone.

Evidence: Census Building Permits Survey — permitted units · Redfin Data Center — inventory, days on market, and price cuts

04
Entry cost and affordability

Gross yields cluster narrowly while tenant income measures diverge

Simple gross yields across eight measured metros had a 4.8% median and a relatively narrow 4.2% to 5.2% 10th-to-90th-percentile range. Jamestown stood at 5.8%, Minot at 5.0% and Wahpeton at 4.9%. These are gross rent-to-value measures, not returns after vacancy, maintenance, capital work, taxes, insurance, financing or management.

Tenant-income measures vary more meaningfully. The metro median rent-to-income ratio was 17.9%, with a 16.9% to 20.3% central range. Jamestown's measure was 21.7%, compared with 17.6% in Minot and 15.4% in Wahpeton. Measured market rent was 105.7% of the two-bedroom HUD Fair Market Rent at the metro median and 131.1% at the 90th percentile. Because the market-rent series is not a property-specific two-bedroom quote, that comparison is a screening flag rather than proof of attainable rent or subsidy compatibility.

Evidence: Census ACS 5-year — household income · HUD Fair Market Rents — Section 8 standard · Zillow ZHVI — metro home values · Zillow ZORI — metro market rents

05
Housing stock and tenant conditions

High total vacancy does not prevent renter stress in small counties

Across all 53 counties, the median ACS total vacancy rate was 20.2%, reaching 28.1% at the 90th percentile. The median renter share was 23.9%, while 79.1% of housing was single-family and the median year built was 1971. Total vacancy includes units that may not be available, suitable or priced for long-term renters, so it cannot be read as rental availability.

Renter burden was 35.0% at the county median and 51.2% at the 90th percentile. Grant County, with 2,269 residents, combined 35.2% vacancy with 62.0% of renters spending at least 30% of income on rent. Emmons County recorded 25.5% vacancy and 57.2% renter burden; Mercer County recorded 23.0% and 55.4%. The coexistence of vacancy and burden makes unit condition, tenure and attainable local rent essential screening questions, especially because these are five-year county estimates rather than current property observations.

Evidence: Census ACS 5-year — county housing value, tenure and stock

06
Physical risk and property tax

Inland flood dominates the leading-hazard labels, while tax costs vary by county

FEMA assigns inland flood as the mutually exclusive leading-hazard label in 47 counties, hail in three, strong wind in two and wildfire in one. These counts do not overlap. They describe each county's leading label, not whether a parcel is exposed, damaged or insurable at a particular price. County climate loss ratios ranged from 0.07% at the 10th percentile to 0.18% at the 90th percentile; Oliver County's ratio was 0.31%.

Across 53 counties, the median effective property-tax rate was 0.92%, with a 0.54% to 1.12% 10th-to-90th-percentile range. Median tax bills over the same distribution ranged from $857 to $2,387. Cavalier County had a 1.34% rate, Cass County 1.20% and Foster County 1.19%. These county measures can flag operating-cost differences, but they do not replace a parcel's assessed value, exemptions, actual tax bill or insurance quote.

Evidence: FEMA National Risk Index — hazard loss ratios · Census ACS 5-year — effective property tax

Evidence selected for North Dakota

The ranges behind the analysis

Each row keeps its own unit and shows the measured 10th percentile, median and 90th percentile. A single-value row is labelled directly.

Price and rent momentumAre home values and asking rents moving together or separating?
10th pct.median90th pct.Home-value change3.6%5.6%7.6%Asking-rent change-1.6%4.1%6.9%Rent minus price-1.5%
Employment and household movementDo jobs, household movement and mover income point in the same direction?
10th pct.median90th pct.Job change-1.1%0.3%1.5%Net migration / 1k0.1Net household movement100
Supply and resale conditionsWhat do permits, inventory, marketing time and price cuts say about pressure?
10th pct.median90th pct.Permits / 1k1.52.23.4Months of supply2.3×2.8×4.1×Days on market19 days38 days75 daysListings with cuts14.8%24.0%26.6%
Shape of the state

Distribution before conclusion

A statewide median can hide a wide spread. These SVG charts render at build time and carry no chart library or browser-side data request.

Metro score distribution8 scored metros · median 64.5
00–19020–39240–59560–79180–100
County evidence coverageEvery gap stays visible as missing—not estimated
21%11/53Rent100%53/53Climate89%47/53Migration
Highest measured metro gross yieldsscreening metric only · before expenses and financing
Jamestown5.8%Minot5.0%Wahpeton4.9%Grand Forks4.9%Dickinson4.7%Bismarck4.6%Williston4.2%
Metro leaderboard

Markets touching North Dakota

Multi-state CBSAs appear in every member state. Score is still a metro score; no value is reweighted into a statewide ranking.

#MetroScorePriceRentYieldJobs
1Minot, ND80$274k$1,1465.0%▲ 0.2%
2Wahpeton, ND67$231k$9434.9%▲ 0.3%
3Grand Forks, ND65$282k$1,1484.9%▲ 0.3%
4Jamestown, ND65$233k$1,1175.8%▲ 1.5%
5Dickinson, ND64$328k$1,2974.7%▲ 1.6%
6Bismarck, ND61$360k$1,3714.6%▲ 0.3%
7Williston, ND45$356k$1,2564.2%▼ 1.2%
8Fargo, ND40$329k$1,1314.1%▼ 1.1%
Below the metro line

Largest counties in North Dakota

County figures join on the five-digit FIPS code. The table uses measured local values and prints “n/a” wherever a publisher has no record.

CountyPopulationPriceRentYieldHazard
Cass County, ND193,400$340k$1,1173.9%inland flooding
Burleigh County, ND100,600$374k$1,3794.4%inland flooding
Grand Forks County, ND72,923$297k$1,1694.7%inland flooding
Ward County, ND68,973$287k$1,1464.8%inland flooding
Williams County, ND39,555$356k$1,2564.2%inland flooding
Morton County, ND33,777$327k$1,4105.2%inland flooding
Stark County, ND33,302$324k$1,2974.8%inland flooding
Stutsman County, ND21,549$233k$1,1175.7%inland flooding
Richland County, ND16,584$234k$9034.6%inland flooding
McKenzie County, ND14,321$377k$1,3224.2%inland flooding
Rolette County, ND11,924n/an/an/awildfire
Ramsey County, ND11,556$232kn/an/ainland flooding
County yield sample11/53counties have the rent needed to compute yield
Statewide net migration+100IRS tax-return households summed across counties
Median investor share6.7%among counties with HMDA purchase records
Sources used in this analysis

Measured releases, not a global source count

Only sources supporting the selected evidence modules are listed here.

Bear case

What can break the thesis

  1. Coverage is incomplete: current county rent data cover 11 of 53 counties, county listing data cover 21, and metro resale data cover six markets.
  2. The sources use different periods and methods, including older IRS migration data, ACS five-year estimates and 2026 market trackers; their alignment cannot establish a current causal relationship.
  3. Gross yields omit vacancy, operating expenses, capital repairs, financing, taxes and insurance, so they may overstate property-level cash performance.
  4. Building permits are not completions or confirmed rentals, while ACS total vacancy is not the same as available rental vacancy; either measure can misstate competitive supply.
  5. FEMA leading-hazard labels and county loss ratios do not establish parcel exposure, and county tax distributions do not establish a property's actual bill.
Investor questions

Before underwriting a property

Are asking rents keeping pace with home values?

Not at the median of the eight measured metros: values rose 5.6% and rents 4.1%, a 1.5-percentage-point gap. Grand Forks and Minot are counterexamples where rent growth exceeded value growth.

Do employment and migration show clear rental-demand strength?

No clear combined signal. Median metro job growth was positive at 0.3%, but net migration across 47 counties was only 100 people, or 0.1 per 1,000, and aggregate mover income had a $331,603 outbound gap.

Where does measured resale liquidity look weakest?

Among the named metro observations, Wahpeton had 79 days on market, 4.8 months of supply and a 96.6% sale-to-list ratio. Dickinson had 71 days and 3.4 months of supply. These figures do not establish conditions for every property in either metro.

Do the reported gross yields demonstrate positive cash flow?

No. The measured metro median was 4.8%, with a 4.2% to 5.2% central range, but those gross yields exclude property-level vacancy, expenses, financing and capital work.

Does the inland-flood label mean a property is exposed?

No. Inland flood is the mutually exclusive leading-hazard label for 47 counties; it is not parcel-level exposure. A property decision still requires parcel-specific hazard and insurance information.