States / Florida
State rental intelligence

Florida rental market data

A source-traced view across 26 metro markets and 67 counties. State figures below are labelled medians and totals—not a made-up statewide investment score.

24/26 metros scored67/67 counties with FEMA risk14 sources used in this analysis
Median scored metro29.5out of 100 · 24 measured metros
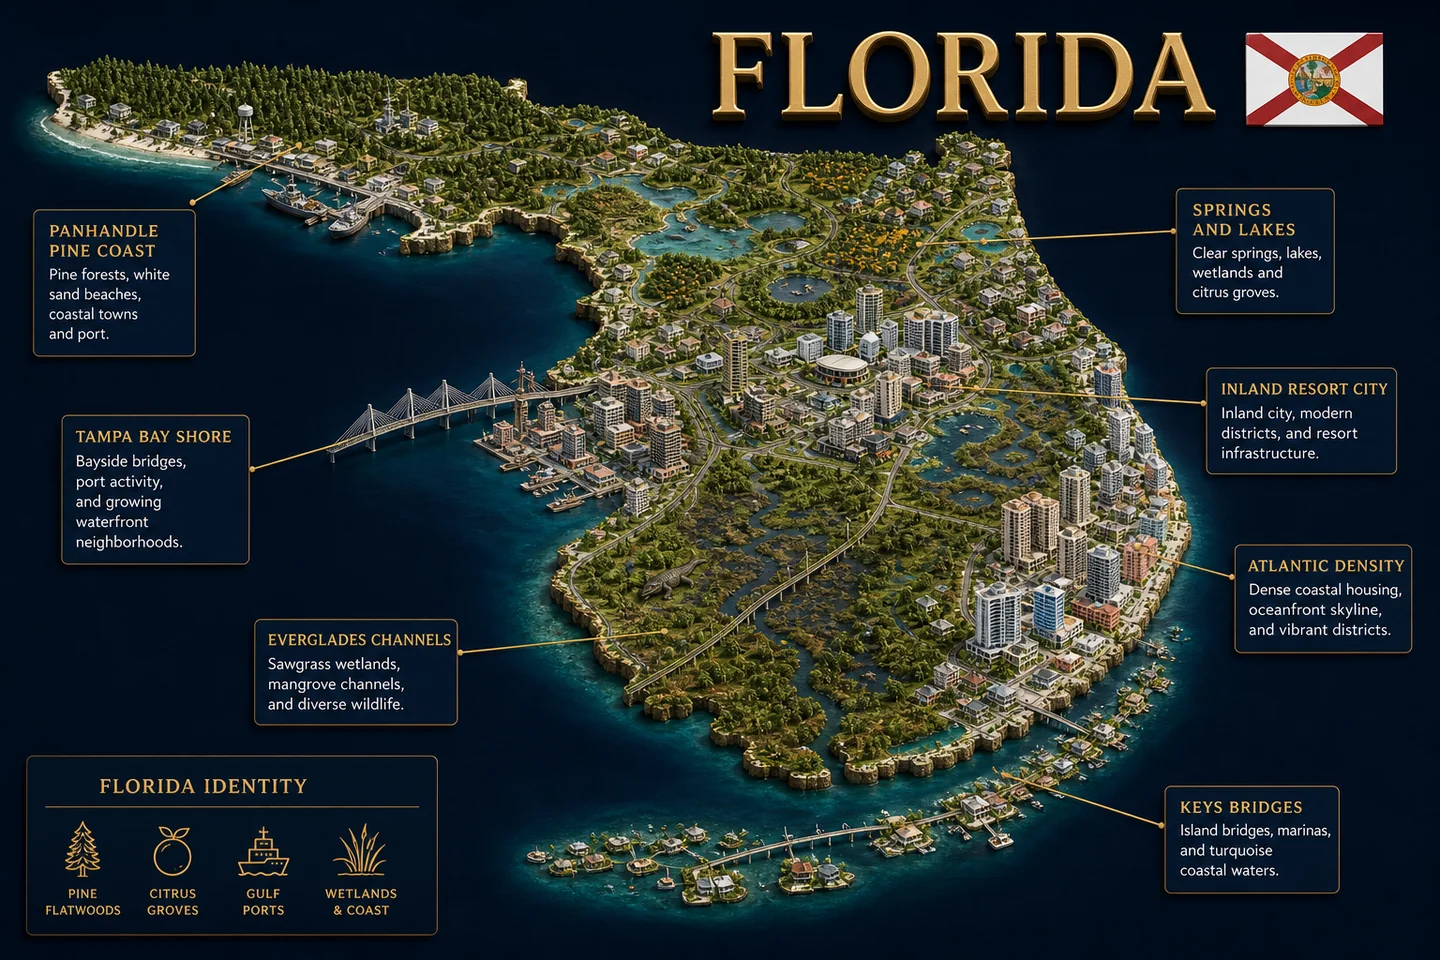
Florida identity diorama showing regional landscape, cities, housing, and infrastructure
Median metro home value$341kmedian across published metro values
Median metro rent$1,861monthly · published metro values
Median gross yield6.7%annual rent ÷ price · before costs
Median job trend▲ 0.2%trailing 12-month metro employment
State research brief

Asking rents rose 1.1% at the measured-metro median while home values fell 2.2%, opening a basis-versus-rent screen even as resale liquidity, tenant strain and hazard costs remain unresolved.

Updated 2026-07-31 · evidence current to the releases listed below.

Across Florida's 26 measured metros, the median home-value change was negative, while asking-rent growth across 24 metros remained positive. The supplied rent-minus-price growth gap was 3.4 percentage points. That separation favors screening for a lower acquisition basis supported by current rent, rather than relying on appreciation.

This is not a statewide buy signal. Positive net migration and slightly positive median job growth are genuine counter-signals to the housing slowdown, and the FHFA county price measure is firmer than the Zillow county measure. At the same time, long marketing periods, elevated renter burdens, permit activity in selected metros and county-level hazard costs require local underwriting. The packet does not provide property insurance quotes, operating expenses, achieved lease rents or parcel-level hazard exposure.

01

Median metro rent growth of 1.1% versus home-value growth of -2.2% → screen for rent-supported acquisition basis rather than appreciation dependence

02

Median conditions of 4.2 months of supply, 69 days on market and a 96.7% sale-to-list ratio → test seller flexibility and allow for slower resale

03

Net migration of 55,518 and 0.2% median metro job growth → retain a demand case, but validate it at the target submarket and tenant segment

04

A 56.0% median county renter-burden share → keep rent-growth and collection assumptions conservative

05

County loss ratios and effective tax rates vary materially → obtain property-specific insurance and tax costs before comparing yields

01
Price and rent momentum

Rents are edging up as metro values retreat

Median home-value growth across 26 measured metros was -2.2%, with the 10th-to-90th percentile running from -5.0% to 0.3%. Asking-rent growth was available for 24 metros and had a 1.1% median, ranging from -0.7% at the 10th percentile to 2.6% at the 90th. The supplied difference between median rent and price momentum was 3.4 percentage points.

The relationship still varies by market. Key West combined a $966,271 value, $3,320 monthly rent and 4.1% gross yield, while Pensacola recorded 1.0% value growth and 2.7% rent growth. Screening should therefore focus on the local price paid, achievable rent and yield rather than treating the median divergence as universal.

Evidence: Zillow ZHVI — metro home values · Zillow ZORI — metro market rents

02
Supply and resale conditions

Longer selling periods improve negotiating leverage, but permit hotspots complicate supply

Across 24 measured metros, the medians were 4.2 months of supply, 69 days on market, a 30.3% price-drop share and a 96.7% sale-to-list ratio. The 90th percentile reached 7.1 months of supply and 94 days on market. Okeechobee was more extended at 167 days and 7.2 months of supply, with a 95.2% sale-to-list ratio. Key West recorded 109 days, 6.7 months and a 94.1% sale-to-list ratio.

Construction screening points in a different direction. Permits per 1,000 residents were 29.5 in The Villages, 17.5 in Punta Gorda and 16.3 in Ocala, compared with a 7.8 measured-metro median. Longer listing periods can support price negotiation, but high permitting adds a separate supply question. Permits do not establish when units will be delivered, whether they will compete for the same tenants or whether proposed projects will be completed.

Evidence: Census Building Permits Survey — permitted units · Redfin Data Center — inventory, days on market, and price cuts

03
Employment and household movement

Migration remains positive, while typical job growth is slight

Across all 67 counties, 734,244 movers entered and 678,726 left, producing measured net migration of 55,518, or 2.5 people per 1,000 residents. This is a genuine demand-side counter-signal to falling median home values.

Employment is less decisive. The median year-over-year change across 26 metros was 0.2%, with the 10th-to-90th percentile spanning -1.1% to 1.5%. The Villages, Clewiston and Ocala were stronger examples at 2.8%, 2.3% and 1.6%, respectively. Migration and employment support a local demand check, but these figures do not establish rental absorption, tenant income quality or demand for a particular property type.

Evidence: Census ACS 5-year — population · BLS CES — payroll employment · BLS LAUS — resident employment · IRS SOI — county migration and mover income

04
Housing stock and tenant conditions

High renter burdens limit confidence in further rent increases

Across 67 counties, the median share of renters spending at least 30% of income on rent was 56.0%; the 10th-to-90th percentile range was 45.5% to 62.7%. The measured shares were still higher in Osceola County at 65.4%, St. Lucie County at 65.3% and Broward County at 65.2%. These figures make aggressive rent-growth assumptions harder to support, even where asking rents are currently rising.

The median county vacancy rate was 15.9%, and the 90th percentile was 29.8%. Walton County, Franklin County and Monroe County recorded 43.9%, 42.2% and 37.3%, respectively. The packet does not identify which vacant units are available to long-term tenants, so these rates cannot by themselves establish rental oversupply. Unit-level occupancy, concessions, collections and lease-renewal data remain necessary.

Evidence: Census ACS 5-year — county housing value, tenure and stock

05
County market dispersion

County price gauges do not tell one consistent story

Zillow county values showed a -1.4% median annual change across 67 counties, with the 10th-to-90th percentile spanning -3.7% to 3.7%. FHFA's measure covered 63 counties and had a positive 0.3% median, with a wider -3.4% to 5.2% range. Its median five-year increase was 60.1%. The series are not interchangeable, and their disagreement is a reason to verify recent comparable sales rather than assert uniform depreciation.

County listing data still show pockets of weak liquidity. The median was 77 days across 59 measured counties. Monroe County recorded 103 days and an 18.8% pending ratio; Collier County recorded 102 days and 24.2%; Hardee County recorded 101 days and 28.0%. Those conditions can improve acquisition leverage, but they also warn that an eventual resale may require more time.

Evidence: FHFA House Price Index — annual county appreciation · Realtor.com Economic Research — county listing inventory · Zillow ZHVI and ZORI — county values and rents

06
Physical risk and property tax

Hazard and tax costs vary enough to change local underwriting

FEMA assigns hurricane as the mutually exclusive leading-hazard label in 43 counties, inland flood in 23 and strong wind in one. These are county-level leading labels, not statements that every parcel has that exposure. The county loss-ratio median was 0.24% and the 90th percentile was 0.41%; Gulf County, Indian River County and Monroe County measured 0.55%, 0.52% and 0.47%, respectively.

The effective property-tax-rate median was 0.72%, with a 0.84% 90th percentile. Alachua County measured 0.96%, Broward County 0.94% and St. Lucie County 0.93%. These county figures belong in an initial expense screen, but they cannot substitute for a parcel tax bill, insurance quote, deductible review, flood determination or assessment history.

Evidence: FEMA National Risk Index — hazard loss ratios · Census ACS 5-year — effective property tax

Evidence selected for Florida

The ranges behind the analysis

Each row keeps its own unit and shows the measured 10th percentile, median and 90th percentile. A single-value row is labelled directly.

Price and rent momentumAre home values and asking rents moving together or separating?
10th pct.median90th pct.Home-value change-5.0%-2.2%0.3%Asking-rent change-0.7%1.1%2.6%Rent minus price3.4%
Supply and resale conditionsWhat do permits, inventory, marketing time and price cuts say about pressure?
10th pct.median90th pct.Permits / 1k2.77.815.7Months of supply3.8×4.2×7.0×Days on market47 days69 days94 daysListings with cuts23.6%30.3%33.8%
Employment and household movementDo jobs, household movement and mover income point in the same direction?
10th pct.median90th pct.Job change-1.1%0.2%1.5%Net migration / 1k2.5Net household movement55,518
Shape of the state

Distribution before conclusion

A statewide median can hide a wide spread. These SVG charts render at build time and carry no chart library or browser-side data request.

Metro score distribution24 scored metros · median 29.5
40–191820–39240–59060–79080–100
County evidence coverageEvery gap stays visible as missing—not estimated
66%44/67Rent100%67/67Climate100%67/67Migration
Highest measured metro gross yieldsscreening metric only · before expenses and financing
Clewiston9.2%Punta Gorda7.6%Sebring7.6%Okeechobee7.5%Homosassa Springs7.5%Lakeland7.4%Port St. Lucie7.3%
Metro leaderboard

Markets touching Florida

Multi-state CBSAs appear in every member state. Score is still a metro score; no value is reweighted into a statewide ranking.

#MetroScorePriceRentYieldJobs
1The Villages, FL47$389k$1,7515.4%▲ 2.8%
2Pensacola, FL41$312k$1,7456.7%▲ 0.7%
3Lakeland, FL38$299k$1,8487.4%▲ 1.3%
4Orlando, FL38$387k$1,9726.1%▲ 0.7%
5Ocala, FL37$274k$1,5997.0%▲ 1.6%
6Crestview, FL35$442k$1,9875.4%▲ 0.4%
7Gainesville, FL33$306k$1,6756.6%▲ 0.4%
8North Port, FL32$404k$2,1326.3%▲ 1.2%
9Tallahassee, FL32$287k$1,5136.3%▲ 0.2%
10Deltona, FL31$332k$1,7956.5%▲ 0.5%
11Homosassa Springs, FL31$274k$1,7087.5%▲ 0.6%
12Jacksonville, FL30$354k$1,7085.8%▼ 0.4%

Showing the top 12 scored metros of 26. Unscored metros remain discoverable through the national rankings.

Below the metro line

Largest counties in Florida

County figures join on the five-digit FIPS code. The table uses measured local values and prints “n/a” wherever a publisher has no record.

CountyPopulationPriceRentYieldHazard
Miami-Dade County, FL2,738,356$523k$2,8866.6%hurricane
Broward County, FL1,977,129$424k$2,5177.1%inland flooding
Palm Beach County, FL1,533,806$473k$2,6626.8%hurricane
Hillsborough County, FL1,522,748$380k$2,0256.4%hurricane
Orange County, FL1,471,937$405k$1,9555.8%inland flooding
Duval County, FL1,023,153$297k$1,6166.5%inland flooding
Pinellas County, FL963,481$372k$2,0216.5%hurricane
Lee County, FL817,666$338k$1,8746.6%hurricane
Polk County, FL790,694$299k$1,8487.4%hurricane
Brevard County, FL632,780$344k$1,9146.7%hurricane
Pasco County, FL611,444$332k$2,0297.3%inland flooding
Volusia County, FL579,622$327k$1,7626.5%hurricane
County yield sample44/67counties have the rent needed to compute yield
Statewide net migration+55,518IRS tax-return households summed across counties
Median investor share7.2%among counties with HMDA purchase records
Sources used in this analysis

Measured releases, not a global source count

Only sources supporting the selected evidence modules are listed here.

Bear case

What can break the thesis

  1. The central rent-price divergence combines distributions with different coverage: 26 metros for value growth and 24 for rent growth, so it may not describe a target property.
  2. High permitting in The Villages, Punta Gorda and Ocala could add competing stock, while the packet does not report completions, tenure or lease concessions.
  3. Heavy renter burdens weaken confidence that current asking-rent growth can be repeated or fully achieved.
  4. Zillow and FHFA county price measures point in different directions at their medians, and county listing coverage is limited to 59 areas.
  5. County hazard labels and loss ratios omit parcel exposure, insurance availability, premiums, deductibles, building condition and special assessments.
Investor questions

Before underwriting a property

Are rents broadly outpacing home values in the measured metros?

At the medians, yes: asking rents rose 1.1% while values fell 2.2%, a supplied gap of 3.4 percentage points. The ranges include both declining rents and rising values, so the relationship must be confirmed locally.

Where does the packet show especially weak resale liquidity?

Okeechobee recorded 167 days on market and 7.2 months of supply; Key West recorded 109 days and 6.7 months. At county level, Monroe County, Collier County and Hardee County each exceeded 100 listing days.

Does household and employment demand offset the price softness?

Only partly. Net migration was positive at 55,518, but median metro job growth was just 0.2%, and the measured range included contraction. Neither measure establishes property-level rental absorption.

How much room is there for additional rent increases?

The packet cannot quantify that room. Across counties, 56.0% was the median share of renters spending at least 30% of income on rent, with Osceola County, St. Lucie County and Broward County above 65%.

Can the FEMA data identify a low-risk or insurable property?

No. The data provide county-level leading-hazard labels and loss ratios only. Parcel exposure, elevation, construction features, premiums, deductibles and insurer availability are missing.